- 1 Principle
- 2 Preparation
- 3 Load RNAseq results
- 4 Threshold filtering (DEGs)
- 4.1 Scatter plot
- 5 Assigning genes
- 5.0.1 Venn diagram
- 6 Scenario 1 (Ideal)
- 6.1 Positively regulated by PRMT1
- 6.1.1 Make venn only positive
- 6.1.2 Datatable overlap positive
- 6.1.3 Enrichment analysis
- 6.2 Negatively regulated by PRMT1
- 6.2.1 Make venn only negative
- 6.2.2 Datatable overlap negative
- 6.2.3 Enrichment analysis
- 7 Scenario 2
- 7.1 Knockdown
- 7.1.1 Compare using venn diagram
- 7.1.2 Datatable overlap
- 7.1.3 Enrichment analysis (Positive)
- 7.1.4 Enrichment analysis (negative)
- 7.2 Recovery
- 7.2.1 Datatable
- 7.2.2 Enrichment (Positive)
- 7.2.3 Enrichment (Negative)
- 8 Scenario 3
- 8.1 Make venn
- 8.1.1 Datatable
- 8.1.2 Enrichment (Positive)
- 8.1.3 Enrichment (Negative)
- 9 Conclusion
- 9.1 KEGG term selected
- 9.2 Connecting with clinical specimen
- 9.2.1 Gene filtering
- 9.2.2 Heatmap
- 9.2.3 Correlation
- 9.2.3.1 Corelation matrix
- 9.2.3.2 Correlation plot
- 9.2.3.3 Datatable correlation
- 9.2.3.4 Selected Heatmap and Cor. Matrix
PRMT1 RNAseq recovery
Nur Aziz
2022-07-14
1 Principle
Sample types :
- Scramble
- siPRMT1
- shPRMT1
- shPRMT1 + Flag-PRMT1
2 Preparation
- Install and load libraries
library(kableExtra)
library(tidyverse)
library(dplyr)
library(ggrepel)
library('ggvenn')
library(DT)
library(forcats)
scale_fill_aziz <- function(...){
  library(scales)
  discrete_scale("fill","aziz",manual_pal(values = c("#386cb0","#fdb462","#7fc97f","#a6cee3","#fb9a99","#984ea3","#ffff33")), ...)

}

scale_colour_aziz <- function(...){
  library(scales)
  discrete_scale("colour","aziz",manual_pal(values = c("#386cb0","#fdb462","#7fc97f","#ef3b2c","#662506","#a6cee3","#fb9a99","#984ea3","#ffff33")), ...)
}
theme_Publication <- function(base_size=14, base_family="helvetica") {
  library(grid)
  library(ggthemes)
  (theme_foundation(base_size=base_size, base_family=base_family)
    + theme(plot.title = element_text(face = "bold",
                                      size = rel(1.2), hjust = 0.5),
            text = element_text(),
            panel.background = element_rect(colour = NA),
            plot.background = element_rect(colour = NA),
            panel.border = element_rect(colour = NA),
            axis.title = element_text(face = "bold",size = rel(1)),
            axis.title.y = element_text(angle=90,vjust =2),
            axis.title.x = element_text(vjust = -0.2),
            axis.text = element_text(),
            axis.line = element_line(colour="black"),
            axis.ticks = element_line(),
            panel.grid.major = element_line(colour="#f0f0f0"),
            panel.grid.minor = element_blank(),
            legend.key = element_rect(colour = NA),
            legend.position = "bottom",
            legend.direction = "horizontal",
            legend.key.size= unit(0.2, "cm"),
            legend.margin = unit(0, "cm"),
            legend.title = element_text(face="italic"),
            plot.margin=unit(c(10,5,5,5),"mm"),
            strip.background=element_rect(colour="#f0f0f0",fill="#f0f0f0"),
            strip.text = element_text(face="bold"),
            plot.subtitle = element_text(hjust = 0.5)
    ))
}

create_dt<-function(x){
  DT::datatable(x,
                extensions = 'Buttons',
                options = list(dom='Blfrtip',
                               buttons=c('copy', 'csv', 'excel','pdf', 'print'),
                               lengthMenu=list(c(10,25,50,-1),
                                               c(10,25,50,'All'))))
}
3 Load RNAseq results
fc<-read.delim("~/Repository/repository/docs/PRMT1/FC PRMT.csv") #load dataframe and name it fc
head(fc)
## Gene.symbol Shprmt1..Scrmbl Siprmt1..Scrmbl ShprmtOE..Scrmbl
## 1 IFI27 6.639 230.309 150.286
## 2 SUCNR1 6.262 18.627 13.008
## 3 FN1 6.262 2.964 3.067
## 4 SYTL2 5.833 6.151 15.023
## 5 LGALS9 5.692 17.207 26.792
## 6 CDH17 4.940 2.335 5.451
## ShprmtOE..Shprmt1 Scrmbl Shprmt1 Siprmt1 ShprmtOE
## 1 22.638 1.996 4.727 9.844 9.228
## 2 2.077 1.795 4.441 6.014 5.496
## 3 0.490 1.795 4.441 3.362 3.412
## 4 2.575 1.356 3.900 3.977 5.265
## 5 4.707 3.983 6.492 8.088 8.727
## 6 1.104 2.214 4.518 3.437 4.660fc<-fc %>%
dplyr::select(1,2,3,5,6,7,8,9) #remove unneccessary column (shrecovery/Scramble)
head(fc)## Gene.symbol Shprmt1..Scrmbl Siprmt1..Scrmbl ShprmtOE..Shprmt1 Scrmbl Shprmt1
## 1 IFI27 6.639 230.309 22.638 1.996 4.727
## 2 SUCNR1 6.262 18.627 2.077 1.795 4.441
## 3 FN1 6.262 2.964 0.490 1.795 4.441
## 4 SYTL2 5.833 6.151 2.575 1.356 3.900
## 5 LGALS9 5.692 17.207 4.707 3.983 6.492
## 6 CDH17 4.940 2.335 1.104 2.214 4.518
## Siprmt1 ShprmtOE
## 1 9.844 9.228
## 2 6.014 5.496
## 3 3.362 3.412
## 4 3.977 5.265
## 5 8.088 8.727
## 6 3.437 4.660colnames(fc)## [1] "Gene.symbol" "Shprmt1..Scrmbl" "Siprmt1..Scrmbl"
## [4] "ShprmtOE..Shprmt1" "Scrmbl" "Shprmt1"
## [7] "Siprmt1" "ShprmtOE"{colnames(fc)[1]<-"Gene"
colnames(fc)[2]<-"FC.shPRMT1.per.Scramble"
colnames(fc)[3]<-"FC.siPRMT1.per.Scramble"
colnames(fc)[4]<-"FC.shPRMT1plusPRMT1.per.shPRMT1"
colnames(fc)[5]<-"Scramble"
colnames(fc)[6]<-"shPRMT1"
colnames(fc)[7]<-"siPRMT1"
colnames(fc)[8]<-"shPRMT1plusPRMT1"} #change the column name4 Threshold filtering (DEGs)
- Differentially expressed genes (DEGs) commonly selected after threshold filtering using both log FC value and p-value.
- But since there is no replication in the sample, we can filter DEGs based on log FC value only.
fc<-fc %>%
  mutate(grupSH=case_when(FC.shPRMT1.per.Scramble > 2 ~ 'Upregulated',
                        FC.shPRMT1.per.Scramble < 0.5 ~ 'Downregulated',
                        TRUE ~ 'Not-regulated')) %>%
  mutate(grupSI=case_when(FC.siPRMT1.per.Scramble > 2 ~ 'Upregulated',
                          FC.siPRMT1.per.Scramble < 0.5 ~ 'Downregulated',
                          TRUE ~ 'Not-regulated')) %>%
  mutate(grupREC=case_when(FC.shPRMT1plusPRMT1.per.shPRMT1 > 2 ~ 'Upregulated',
                           FC.shPRMT1plusPRMT1.per.shPRMT1 < 0.5 ~ 'Downregulated',
                          TRUE ~ 'Not-regulated'))

create_dt(fc)
## Warning in instance$preRenderHook(instance): It seems your data is too big
## for client-side DataTables. You may consider server-side processing: https://
## rstudio.github.io/DT/server.html4.1 Scatter plot
# SH vs Scramble
fc %>%
  ggplot(aes(x=Scramble,y=shPRMT1,color=grupSH))+
  geom_point(size=1.5)+
  geom_label_repel(aes(label=ifelse(Gene == 'PRMT1',as.character(Gene),'')),
                  box.padding   = .35,
                  point.padding = 0.5,
                  max.overlaps = Inf,
                  segment.color = 'grey50',show.legend = F)+ #label PRMT1
  theme_classic()+
  scale_colour_manual(values = c('#a6cee3','gray','#fb9a99'))+
  theme_Publication()+
  theme(aspect.ratio = 1)+
  ylab("sh-PRMT1")+
  xlab("Scramble")+
  ggtitle("Group SH")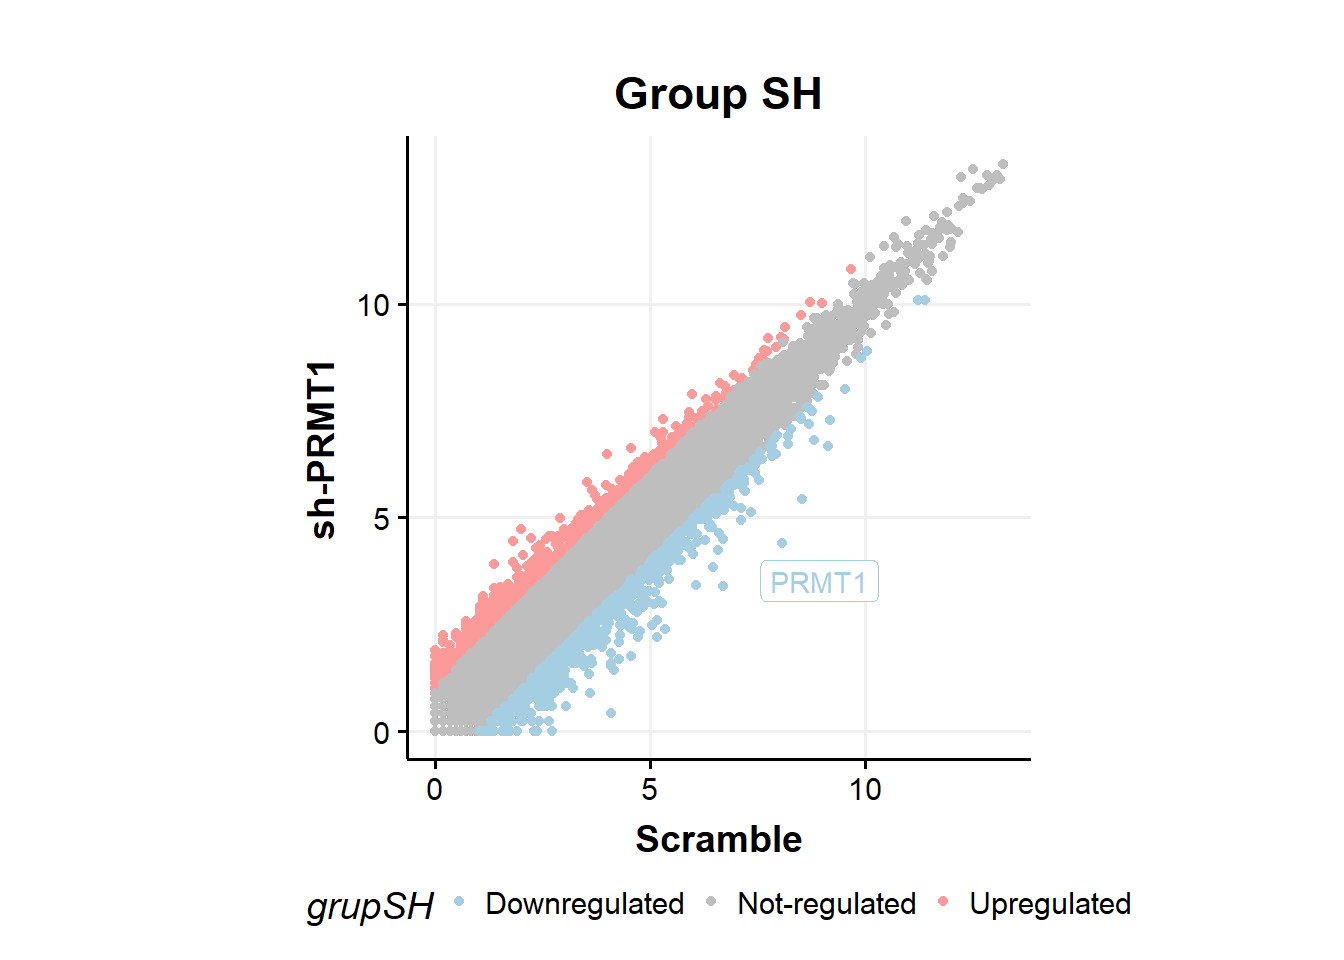
fc %>%
  ggplot(aes(x=Scramble,y=siPRMT1,color=grupSI))+
  geom_point(size=1.5)+
  geom_label_repel(aes(label=ifelse(Gene == 'PRMT1',as.character(Gene),'')),
                  box.padding   = .35,
                  point.padding = 0.5,
                  max.overlaps = Inf,
                  segment.color = 'grey50',show.legend = F)+ #label PRMT1
  theme_classic()+
  scale_colour_manual(values = c('#a6cee3','gray','#fb9a99'))+
  theme_Publication()+
  theme(aspect.ratio = 1)+
    ylab("si-PRMT1")+
  xlab("Scramble")+
  ggtitle("Group SI")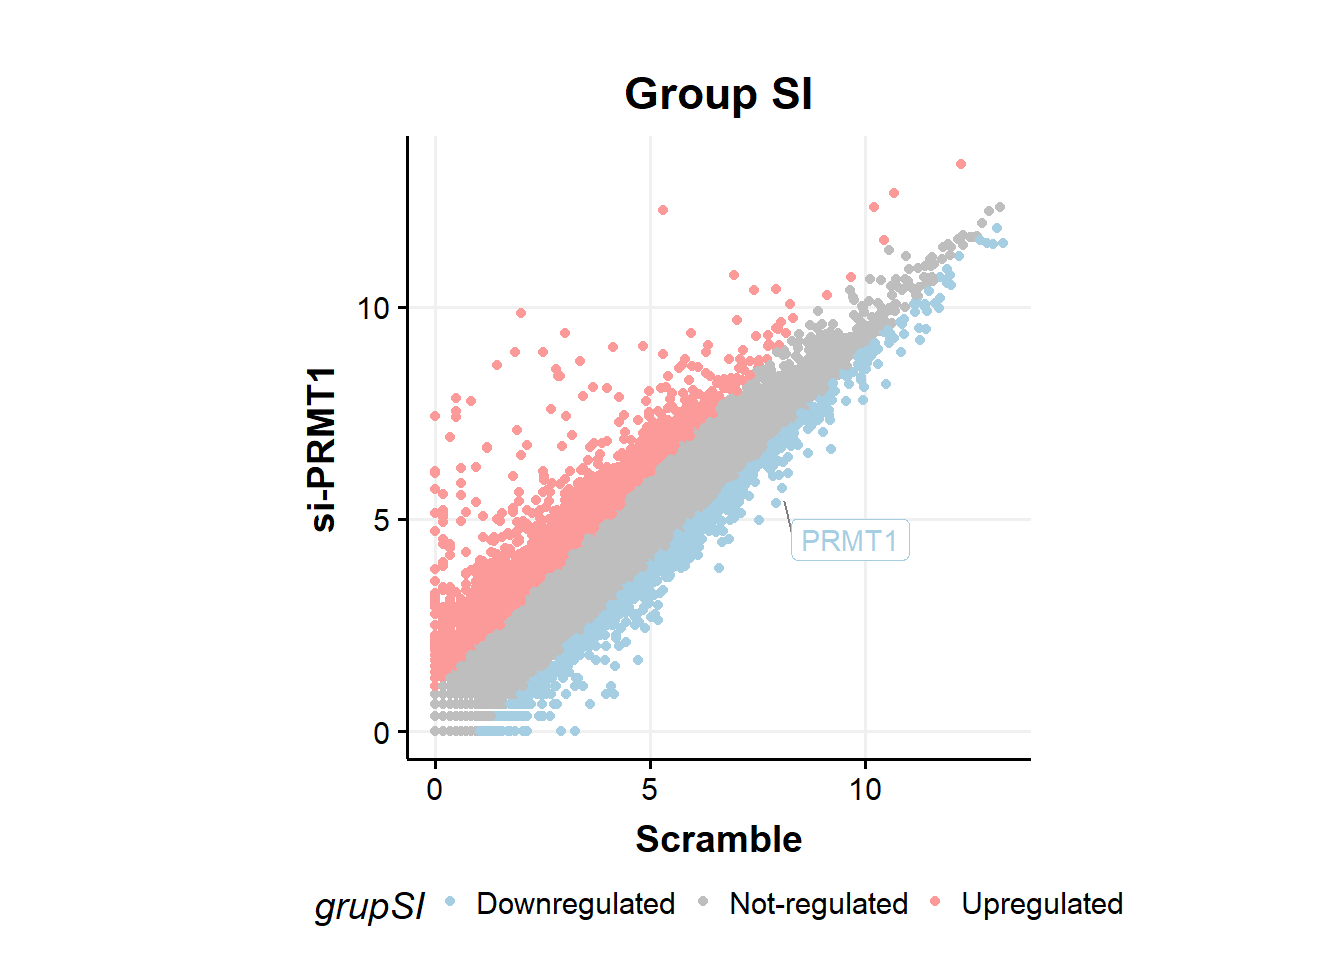
fc %>%
  ggplot(aes(x=shPRMT1,y=shPRMT1plusPRMT1,color=grupREC))+
  geom_point(size=1.5)+
  geom_label_repel(aes(label=ifelse(Gene == 'PRMT1',as.character(Gene),'')),
                  box.padding   = .35,
                  point.padding = 0.5,
                  max.overlaps = Inf,
                  segment.color = 'grey50',show.legend = F)+ #label PRMT1
  theme_classic()+
  scale_colour_manual(values = c('#a6cee3','gray','#fb9a99'))+
  theme_Publication()+
  theme(aspect.ratio = 1)+
  ylab("sh-PRMT1 + Flag-PRMT1")+
  xlab("sh-PRMT1")+
  ggtitle("Group Recovery")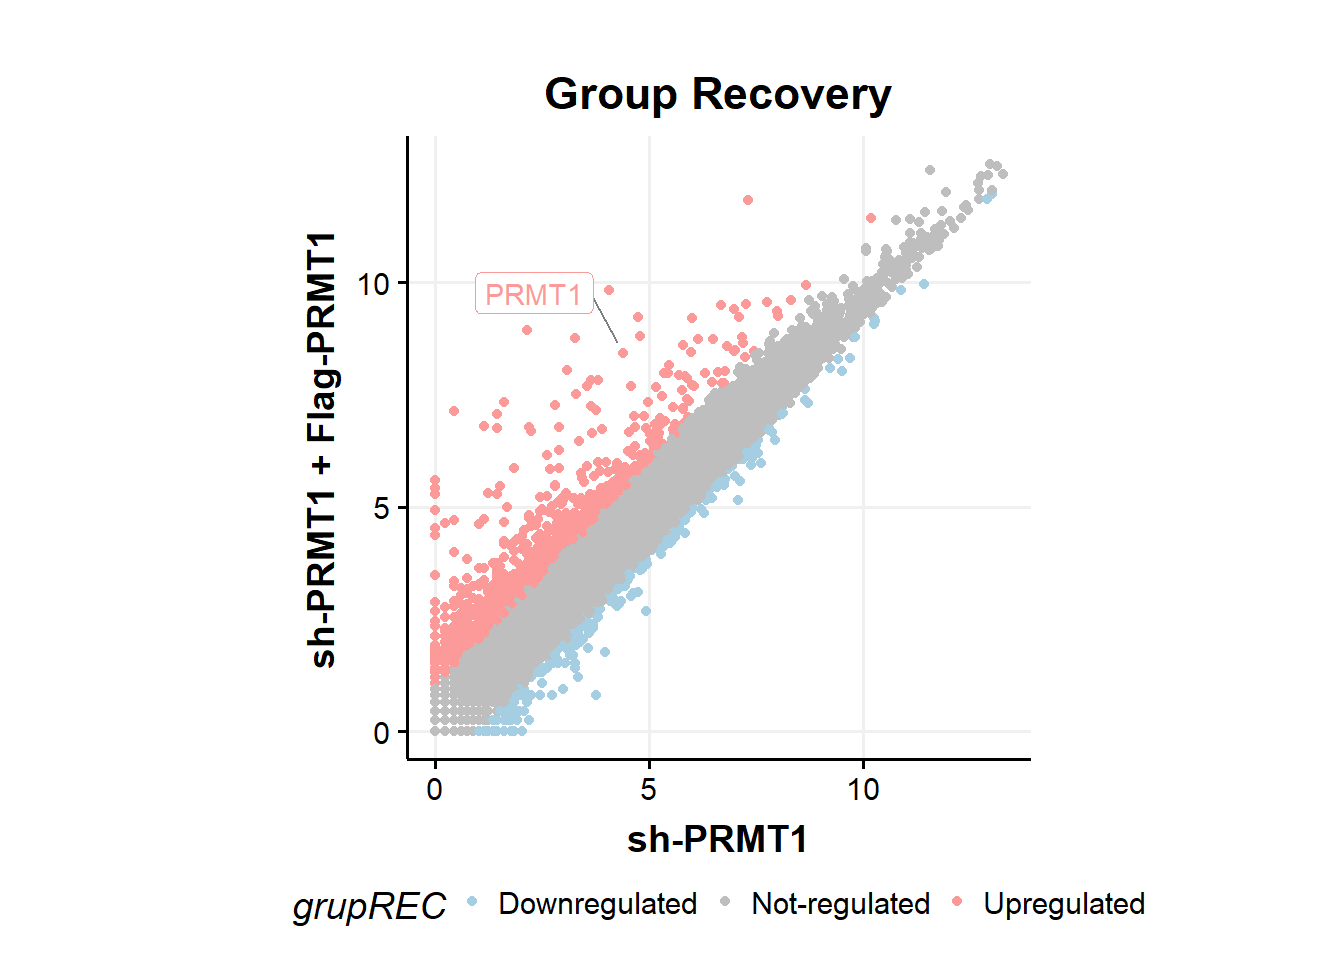
5 Assigning genes
* Make a venn diagram to see overlapping DEGs in 3
conditions.
5.0.1 Venn diagram
# Filtered regulated genes to make venn
SH.regulated<-fc %>%
  filter(grupSH == 'Downregulated' | grupSH == 'Upregulated')
SI.regulated<-fc %>%
  filter(grupSI == 'Downregulated' | grupSI == 'Upregulated')
REC.regulated<-fc %>%
  filter(grupREC == 'Downregulated' | grupREC == 'Upregulated')

D<-list('Group SH'=as.character(SH.regulated$Gene),
        'Group SI'=as.character(SI.regulated$Gene),
        'Group Recovery'=as.character(REC.regulated$Gene))

ggvenn(D,fill_color = c("#386cb0","#fdb462","gray"),fill_alpha = .3,text_size = 5,show_percentage = F)+
  ggtitle("Overlap of all genes passing the threshold (DEGs)")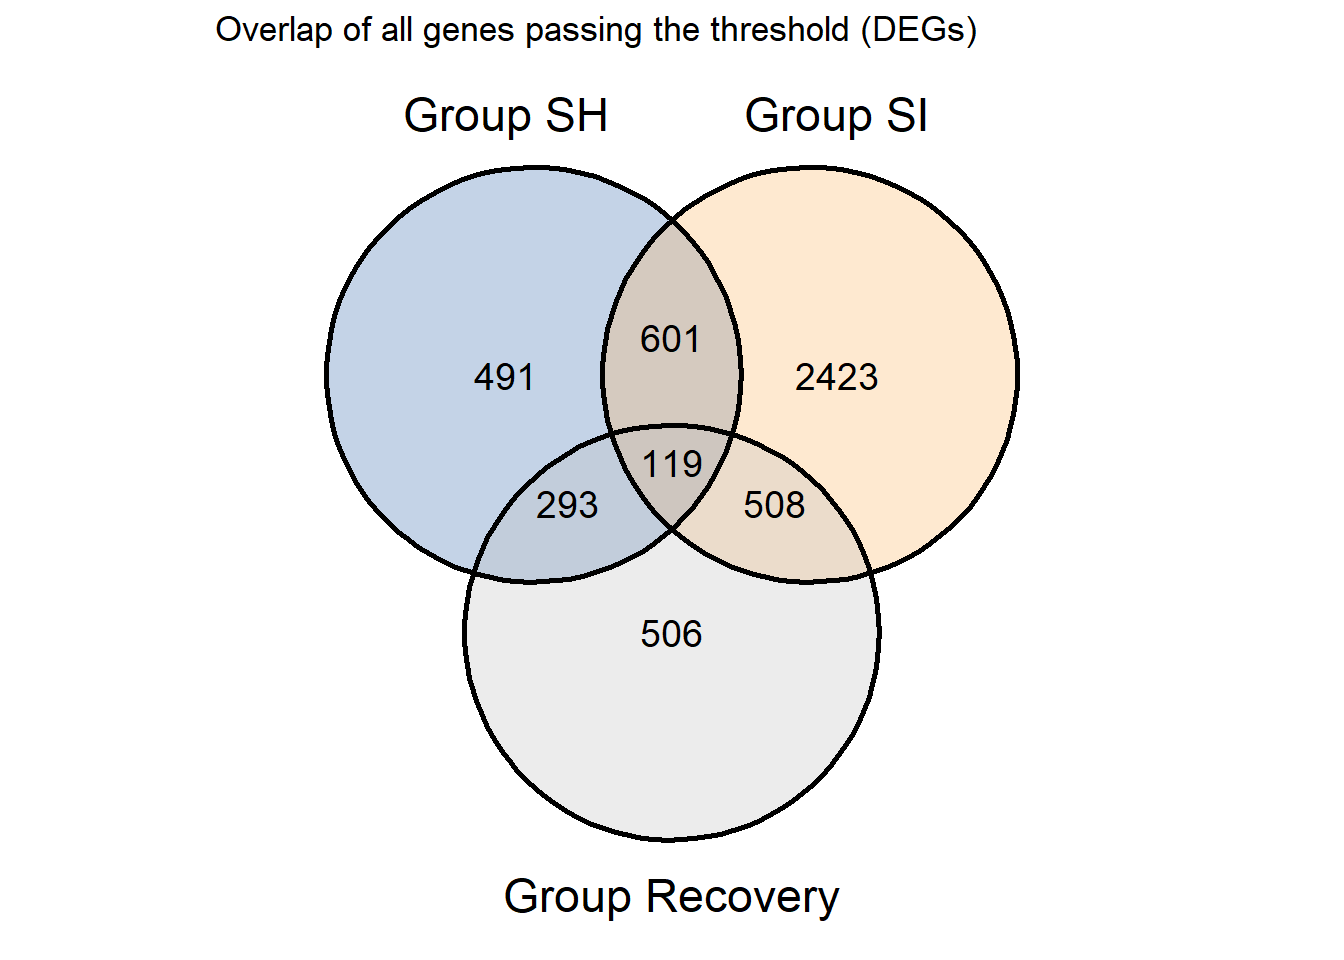
* From venn we can see about 119 DEGs overlap, then we filter again
and assign positive or negatively regulated by PRMT1
#what are those genes?
overlap<-as.data.frame(intersect(as.character(REC.regulated$Gene),intersect(x=as.character(SH.regulated$Gene),y=as.character(SI.regulated$Gene))))
colnames(overlap)[1]<-"Gene"
overlap
## Gene
## 1 IFI27
## 2 SUCNR1
## 3 FN1
## 4 SYTL2
## 5 LGALS9
## 6 APOL1
## 7 IFI6
## 8 SLC16A3
## 9 INPP5D
## 10 NME9
## 11 BST2
## 12 PARP14
## 13 CXCR4
## 14 LOC286437
## 15 DDX58
## 16 RARRES3
## 17 IL18R1
## 18 EVI5L
## 19 CDC14A
## 20 IFIT3
## 21 ID2
## 22 OAS2
## 23 NTN4
## 24 STON2
## 25 NEK7
## 26 GCNT7
## 27 DCLRE1C
## 28 CTSS
## 29 HERC6
## 30 IFIT1
## 31 GSDMB
## 32 ATP11B
## 33 RSAD2
## 34 RND3
## 35 IFI16
## 36 MX1
## 37 PSCA
## 38 AADAC
## 39 MLH3
## 40 C6orf222
## 41 CLDN18
## 42 KLB
## 43 CFB
## 44 FALEC
## 45 NEAT1
## 46 SP140L
## 47 NFKBIZ
## 48 FSBP
## 49 XAF1
## 50 ALPPL2
## 51 GRIN2C
## 52 BIRC3
## 53 IL32
## 54 MGAT3
## 55 CFI
## 56 ZDHHC1
## 57 ANKRD37
## 58 DTX3L
## 59 PTPRB
## 60 NPTXR
## 61 GSTA1
## 62 SPRR1A
## 63 TTC37
## 64 CCDC68
## 65 HLA-F
## 66 BISPR
## 67 PPP1R14C
## 68 IRAK1BP1
## 69 KISS1R
## 70 CARF
## 71 INSIG2
## 72 MTHFSD
## 73 SULT2B1
## 74 CA9
## 75 LAMP3
## 76 PDIK1L
## 77 PTS
## 78 CEBPB
## 79 C5orf56
## 80 LIN54
## 81 TMEM91
## 82 RNF128
## 83 TDRD7
## 84 LOC730183
## 85 DCLRE1A
## 86 DAPK1
## 87 VEPH1
## 88 NUP50-AS1
## 89 TFB2M
## 90 MYC
## 91 IFNGR1
## 92 LOC654342
## 93 CALCOCO1
## 94 KIAA0895
## 95 AMIGO3
## 96 TTC5
## 97 PCOLCE2
## 98 COPS7A
## 99 LOC101927550
## 100 EIF1AD
## 101 AKT3
## 102 INSM1
## 103 C16orf91
## 104 IL18
## 105 ALDH3A1
## 106 DOK3
## 107 TP53INP2
## 108 S100A5
## 109 PIM1
## 110 SNHG21
## 111 PLAU
## 112 SIK1
## 113 ALG13
## 114 AQP3
## 115 GTPBP2
## 116 EPHA2
## 117 MINOS1P1
## 118 MINOS1-NBL1
## 119 PRMT1#leftjoin to other parameter
overlap<-overlap %>%
left_join(fc) %>%
select(Gene,grupSH,grupSI,grupREC)
create_dt(overlap)6 Scenario 1 (Ideal)
6.1 Positively regulated by PRMT1
6.1.1 Make venn only positive
# We can make venn again only positive
pos.SH<-SH.regulated %>%
  filter(grupSH=='Downregulated')
pos.SI<-SI.regulated %>%
  filter(grupSI=='Downregulated')
pos.REC<-REC.regulated %>%
  filter(grupREC=='Upregulated')

s1.list.pos<-list('Group SH'=as.character(pos.SH$Gene),
                   'Group SI'=as.character(pos.SI$Gene),
                   'Group Recovery'=as.character(pos.REC$Gene))

v1pos<-ggvenn(s1.list.pos,fill_color = c("#386cb0","#fdb462","gray"),fill_alpha = .3,text_size = 5,show_percentage = F)+
  ggtitle("Overlap DEGs",subtitle = "Positively regulated by PRMT1")

v1pos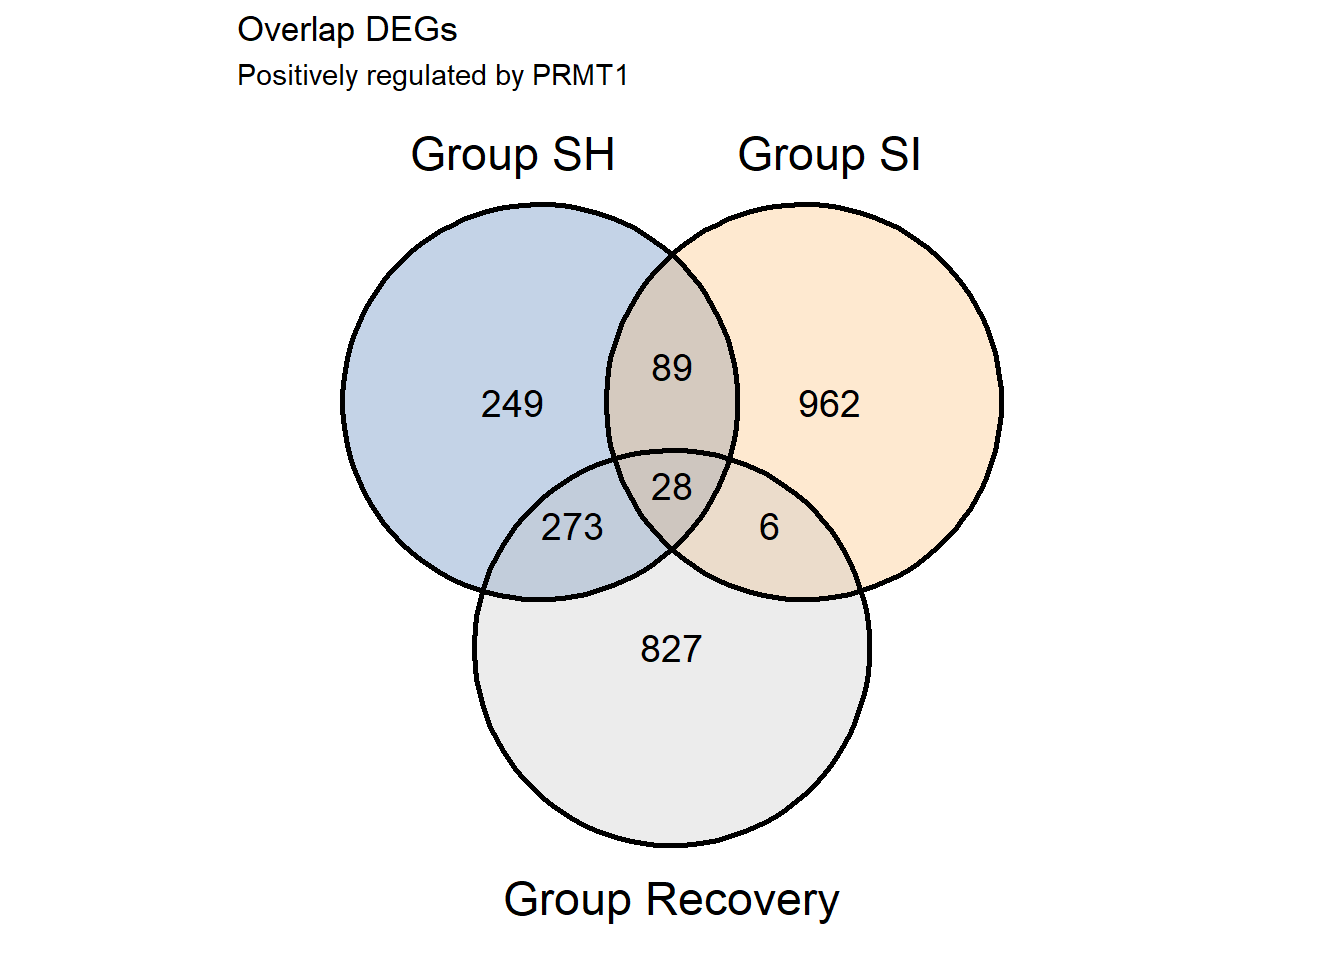
6.1.2 Datatable overlap positive
S1.Positive.cor<-(overlap %>% filter(grupSH == 'Downregulated' & grupSI == 'Downregulated' & grupREC == 'Upregulated'))
create_dt(S1.Positive.cor)6.1.3 Enrichment analysis
library(enrichR)
setEnrichrSite("Enrichr") # Human genes
websiteLive <- TRUE


dbs <- c("KEGG_2021_Human","MSigDB_Hallmark_2020")
if (is.null(dbs)) websiteLive <- FALSE
if (websiteLive) {
    enriched <- enrichr(c(S1.Positive.cor$Gene), dbs)
}
## Uploading data to Enrichr... Done.
## Querying KEGG_2021_Human... Done.
## Querying MSigDB_Hallmark_2020... Done.
## Parsing results... Done.s1.kegg.pos<-as.data.frame(if (websiteLive) enriched[["KEGG_2021_Human"]])
create_dt(s1.kegg.pos)colnames(s1.kegg.pos)## [1] "Term" "Overlap" "P.value"
## [4] "Adjusted.P.value" "Old.P.value" "Old.Adjusted.P.value"
## [7] "Odds.Ratio" "Combined.Score" "Genes"en.kegg.pos<-s1.kegg.pos %>%
filter(P.value < 0.05) %>%
mutate(minlog=-(log10(P.value))) %>%
arrange(desc(minlog)) %>%
slice(1:20) %>%
mutate(name=fct_reorder(Term,minlog)) %>%
ggplot(aes(x=minlog,y=name,fill=minlog))+
geom_bar(stat="identity")+
theme_Publication()+
scale_x_continuous(expand=expand_scale(mult = c(0,0.2)))+
theme(axis.title.y = element_blank(),
legend.position = 'right',
legend.direction = 'vertical',
panel.grid.major.x = element_blank(),
aspect.ratio = 1.8,
legend.key.size= unit(.5, "cm"),
axis.text.y = element_text(size=9.5))+
scale_fill_viridis_c()+
xlab(expression(- log[10]*"(P-value)"))+
labs(fill=expression(- log[10]*"(P-value)"))+
ggtitle("Top 20 KEGG_2021_Human",subtitle = 'Positively regulated by PRMT1')
en.kegg.pos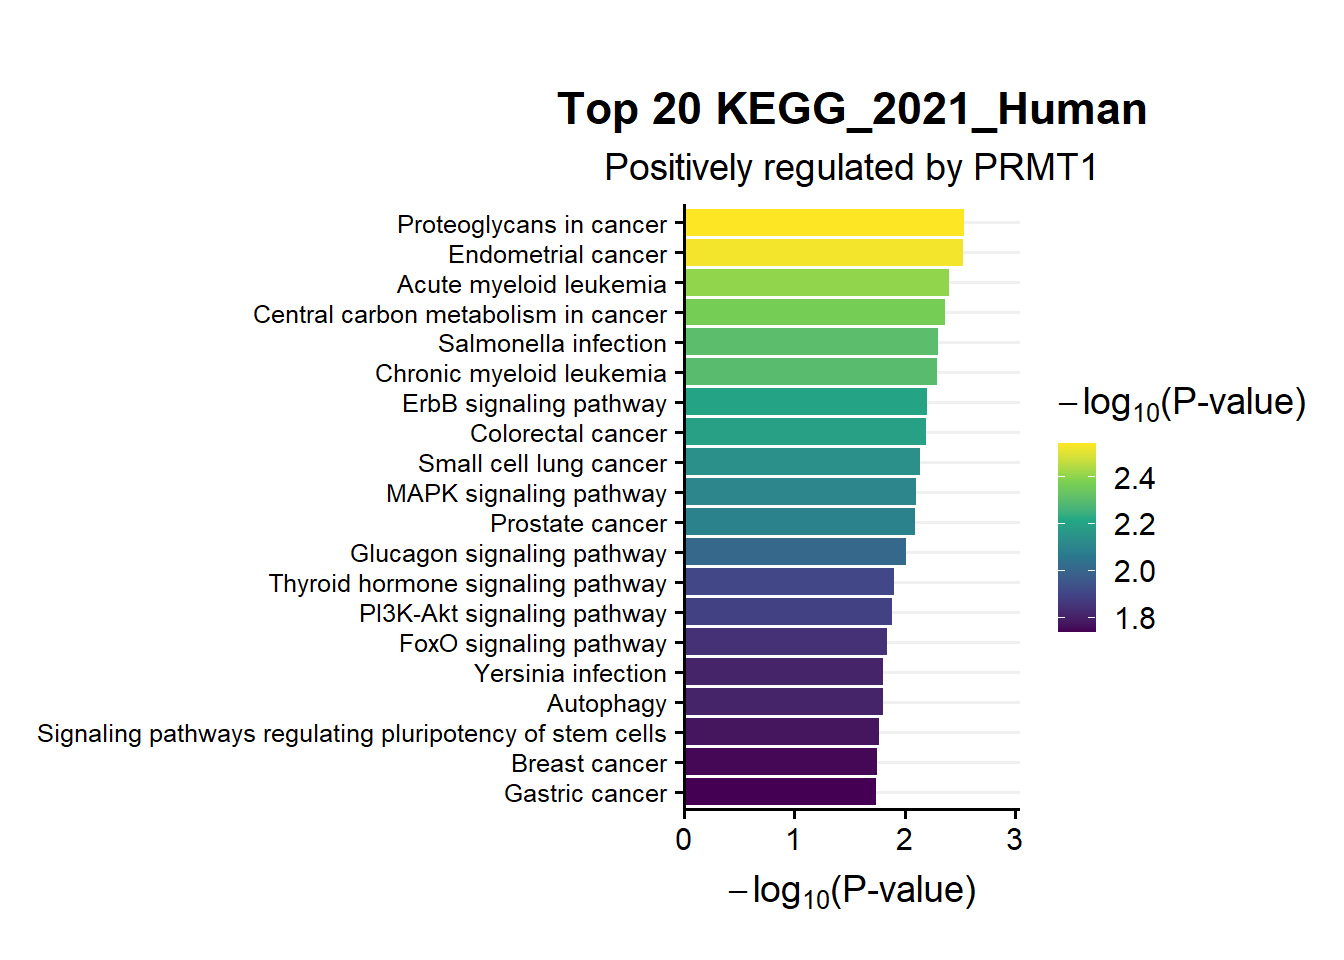
Msig.pos<-as.data.frame(if (websiteLive) enriched[["MSigDB_Hallmark_2020"]])
create_dt(Msig.pos)s1.en.Msig.pos<-Msig.pos %>%
filter(P.value < 0.05) %>%
mutate(minlog=-(log10(P.value))) %>%
arrange(desc(minlog)) %>%
slice(1:20) %>%
mutate(name=fct_reorder(Term,minlog)) %>%
ggplot(aes(x=minlog,y=name,fill=minlog))+
geom_bar(stat="identity")+
theme_Publication()+
scale_x_continuous(expand=expand_scale(mult = c(0,0.2)))+
theme(axis.title.y = element_blank(),
legend.position = 'right',
legend.direction = 'vertical',
panel.grid.major.x = element_blank(),
aspect.ratio = 1,
legend.key.size= unit(.5, "cm"))+
scale_fill_viridis_c()+
xlab(expression(- log[10]*"(P-value)"))+
labs(fill=expression(- log[10]*"(P-value)"))+
ggtitle("MSigDB_Hallmark_2020",subtitle = 'Positively regulated by PRMT1')
s1.en.Msig.pos
6.2 Negatively regulated by PRMT1
6.2.1 Make venn only negative
# We can make venn again only negative
neg.SH<-SH.regulated %>%
  filter(grupSH=='Upregulated')
neg.SI<-SI.regulated %>%
  filter(grupSI=='Upregulated')
neg.REC<-REC.regulated %>%
  filter(grupREC=='Downregulated')

s1.list.neg<-list('Group SH'=as.character(neg.SH$Gene),
                   'Group SI'=as.character(neg.SI$Gene),
                   'Group Recovery'=as.character(neg.REC$Gene))

v1neg<-ggvenn(s1.list.neg,fill_color = c("#386cb0","#fdb462","gray"),fill_alpha = .3,text_size = 5,show_percentage = F)+
  ggtitle("Overlap DEGs",subtitle = "Negatively regulated by PRMT1")
v1neg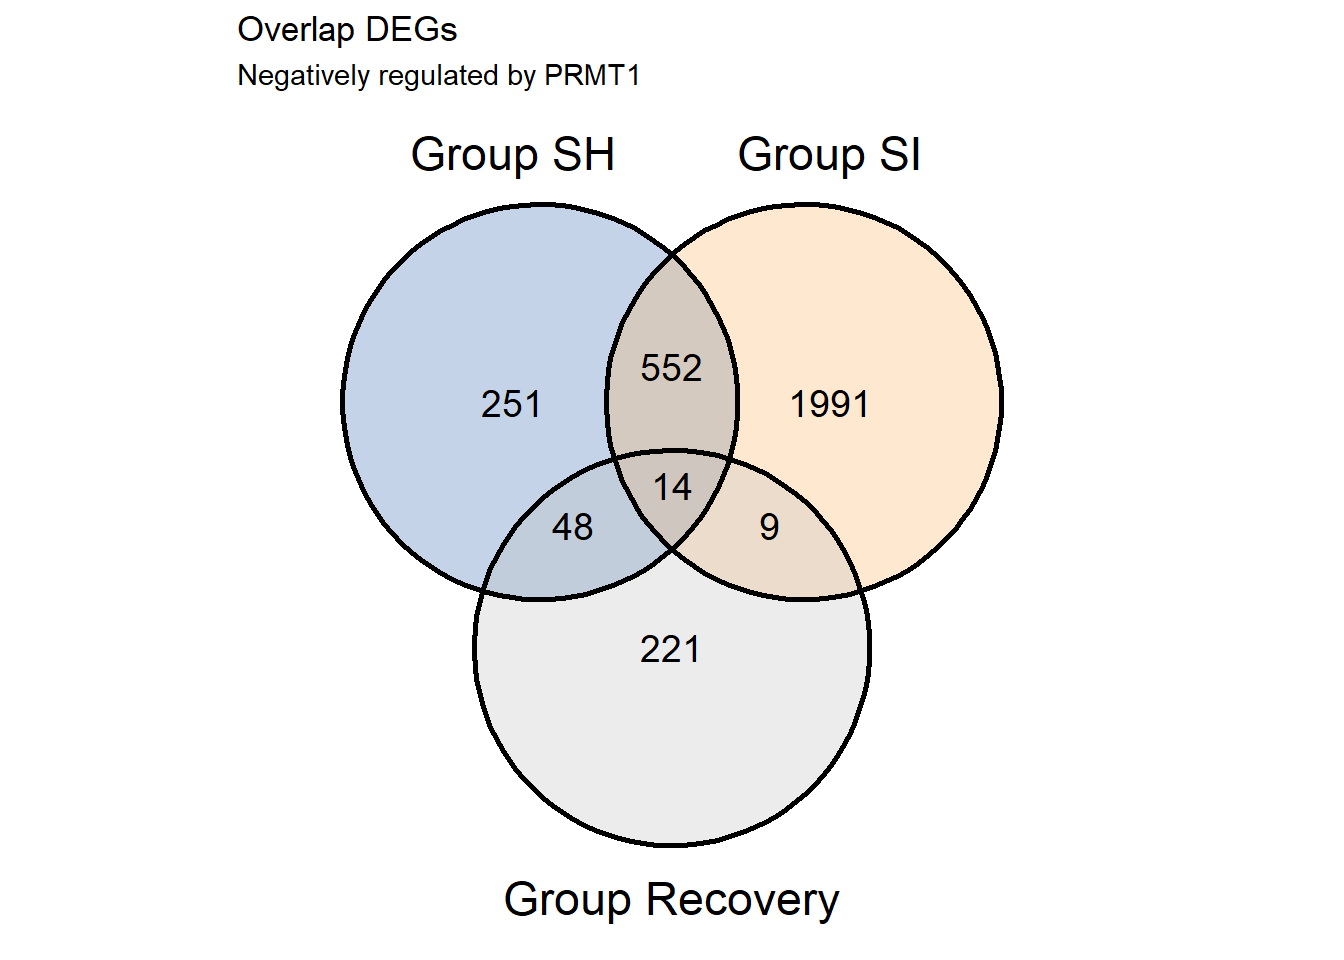
6.2.2 Datatable overlap negative
S1.Negative.cor<-(overlap %>% filter(grupSH == 'Upregulated' & grupSI == 'Upregulated' & grupREC == 'Downregulated'))
create_dt(S1.Negative.cor)6.2.3 Enrichment analysis
library(enrichR)
setEnrichrSite("Enrichr") # Human genes
websiteLive <- TRUE


dbs <- c("KEGG_2021_Human","MSigDB_Hallmark_2020")
if (is.null(dbs)) websiteLive <- FALSE
if (websiteLive) {
    enriched <- enrichr(c(S1.Negative.cor$Gene), dbs)
}
## Uploading data to Enrichr... Done.
## Querying KEGG_2021_Human... Done.
## Querying MSigDB_Hallmark_2020... Done.
## Parsing results... Done.kegg.neg<-as.data.frame(if (websiteLive) enriched[["KEGG_2021_Human"]])
create_dt(kegg.neg)en.kegg.neg<-kegg.neg %>%
filter(P.value < 0.05) %>%
mutate(minlog=-(log10(P.value))) %>%
arrange(desc(minlog)) %>%
slice(1:20) %>%
mutate(name=fct_reorder(Term,minlog)) %>%
ggplot(aes(x=minlog,y=name,fill=minlog))+
geom_bar(stat="identity")+
theme_Publication()+
scale_x_continuous(expand=expand_scale(mult = c(0,0.2)))+
theme(axis.title.y = element_blank(),
legend.position = 'right',
legend.direction = 'vertical',
panel.grid.major.x = element_blank(),
aspect.ratio = 1.65,
legend.key.size= unit(.5, "cm"))+
scale_fill_viridis_c()+
xlab(expression(- log[10]*"(P-value)"))+
labs(fill=expression(- log[10]*"(P-value)"))+
ggtitle("KEGG_2021_Human",subtitle = 'Negatively regulated by PRMT1')
en.kegg.neg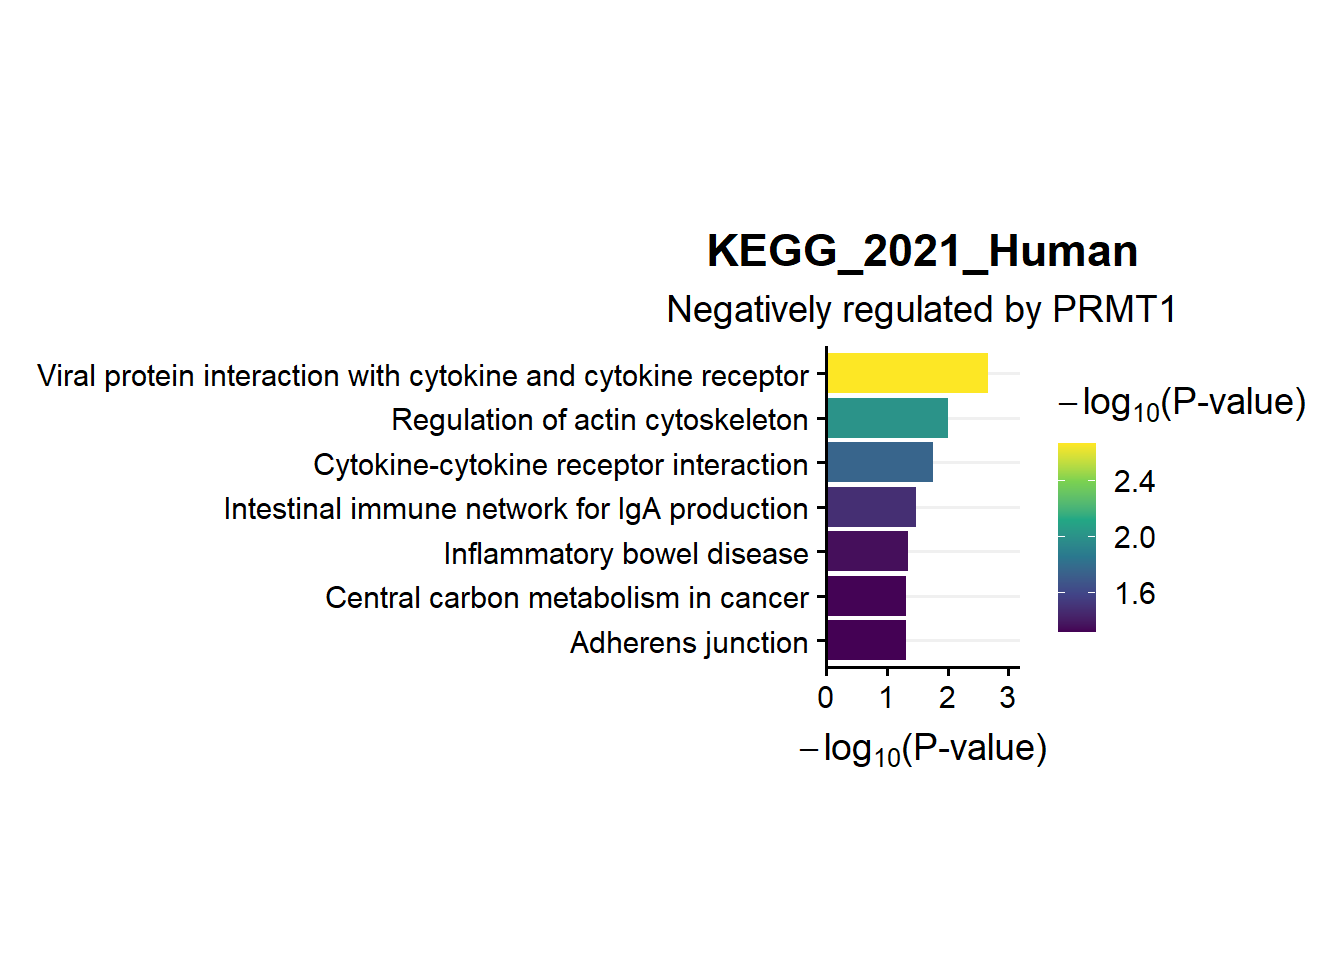
Msig.neg<-as.data.frame(if (websiteLive) enriched[["MSigDB_Hallmark_2020"]])
create_dt(Msig.neg)en.Msig.neg<-Msig.neg %>%
filter(P.value < 0.05) %>%
mutate(minlog=-(log10(P.value))) %>%
arrange(desc(minlog)) %>%
slice(1:20) %>%
mutate(name=fct_reorder(Term,minlog)) %>%
ggplot(aes(x=minlog,y=name,fill=minlog))+
geom_bar(stat="identity")+
theme_Publication()+
scale_x_continuous(expand=expand_scale(mult = c(0,0.2)))+
theme(axis.title.y = element_blank(),
legend.position = 'right',
legend.direction = 'vertical',
panel.grid.major.x = element_blank(),
aspect.ratio = .5,
legend.key.size= unit(.5, "cm"))+
scale_fill_viridis_c()+
xlab(expression(- log[10]*"(P-value)"))+
labs(fill=expression(- log[10]*"(P-value)"))+
ggtitle("MSigDB_Hallmark_2020",subtitle = 'Negatively regulated by PRMT1')
en.Msig.neg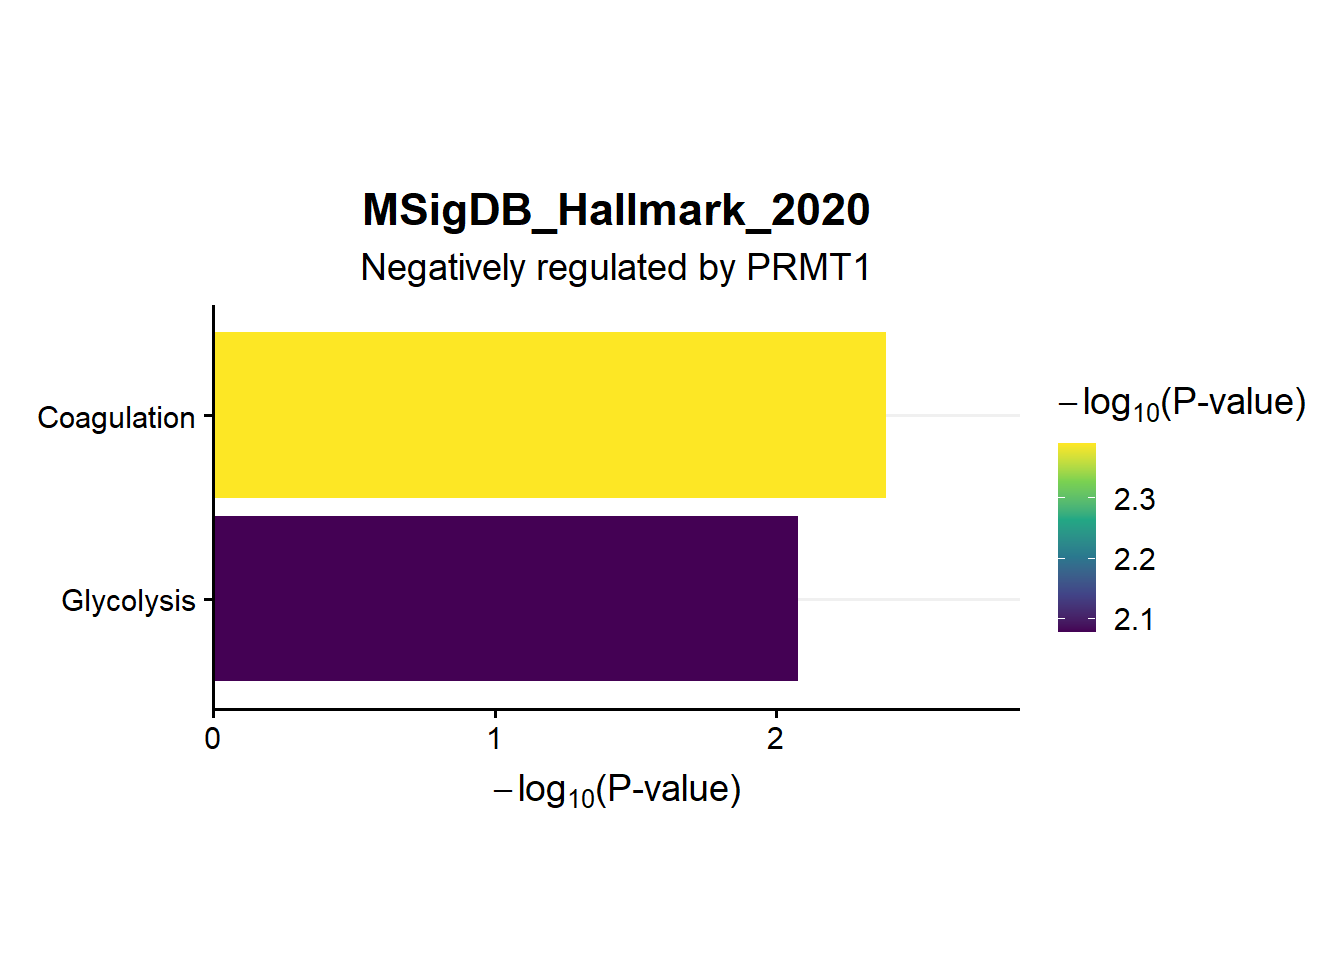
7 Scenario 2
- Scenario 2 consider knockdown and overexpression by analyzing separately
7.1 Knockdown
7.1.1 Compare using venn diagram
library(gridExtra)
grid.arrange(v1pos,v1neg,ncol=2) 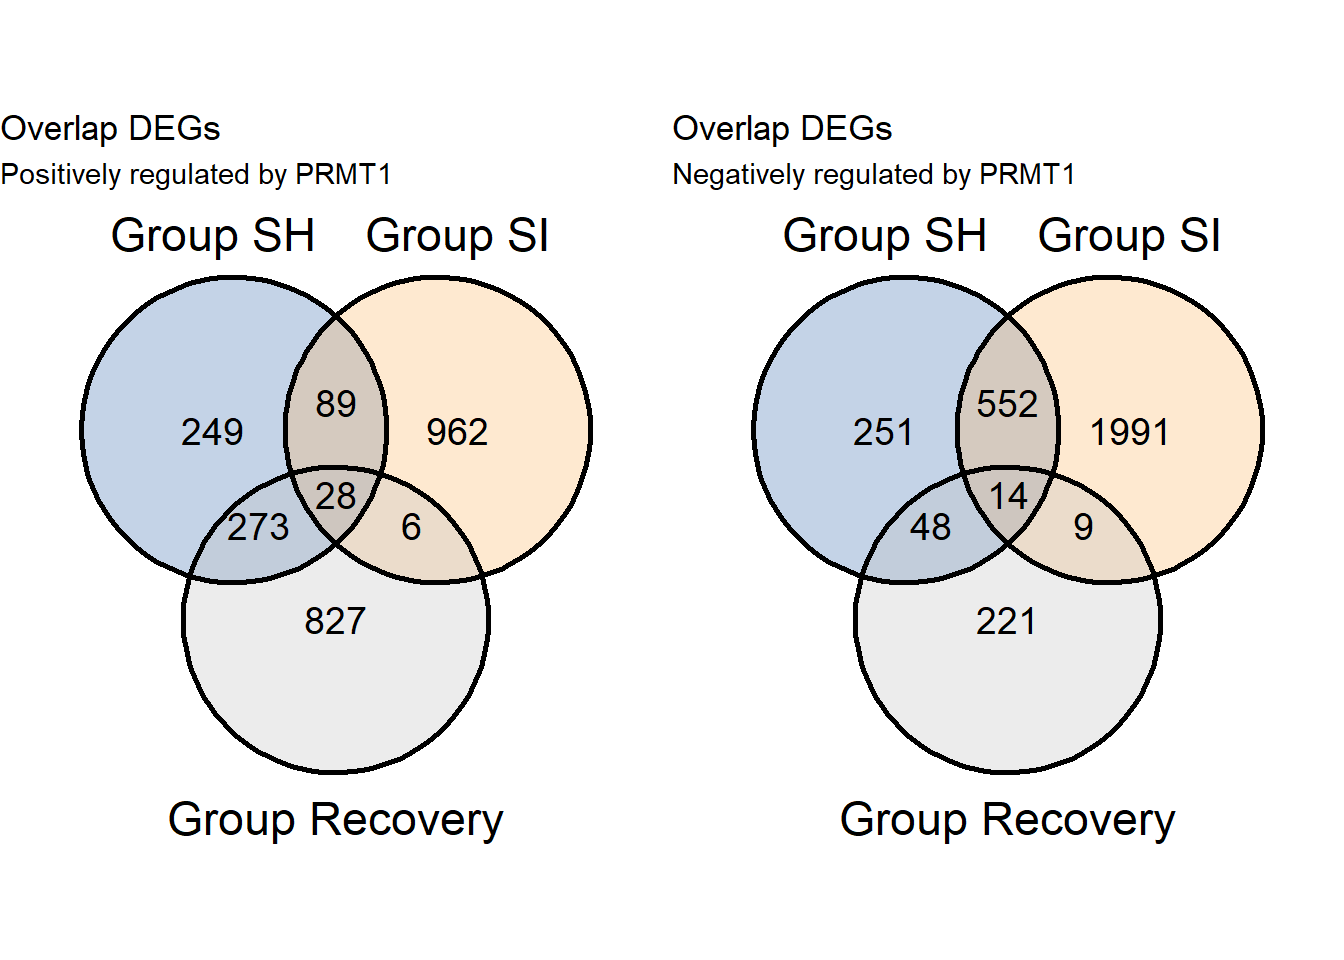
s2.list.pos<-list('Group SH'=as.character(pos.SH$Gene),
                   'Group SI'=as.character(pos.SI$Gene))

v2pos<-ggvenn(s2.list.pos,fill_color = c("#386cb0","#fdb462"),fill_alpha = .3,text_size = 5,show_percentage = F)+
  ggtitle("Overlap DEGs",subtitle = "Positively regulated by PRMT1")

s2.list.neg<-list('Group SH'=as.character(neg.SH$Gene),
                   'Group SI'=as.character(neg.SI$Gene))

v2neg<-ggvenn(s2.list.neg,fill_color = c("#386cb0","#fdb462"),fill_alpha = .3,text_size = 5,show_percentage = F)+
  ggtitle("Overlap DEGs",subtitle = "Negatively regulated by PRMT1")

# Venn only knockdown
grid.arrange(v2pos,v2neg,ncol=2)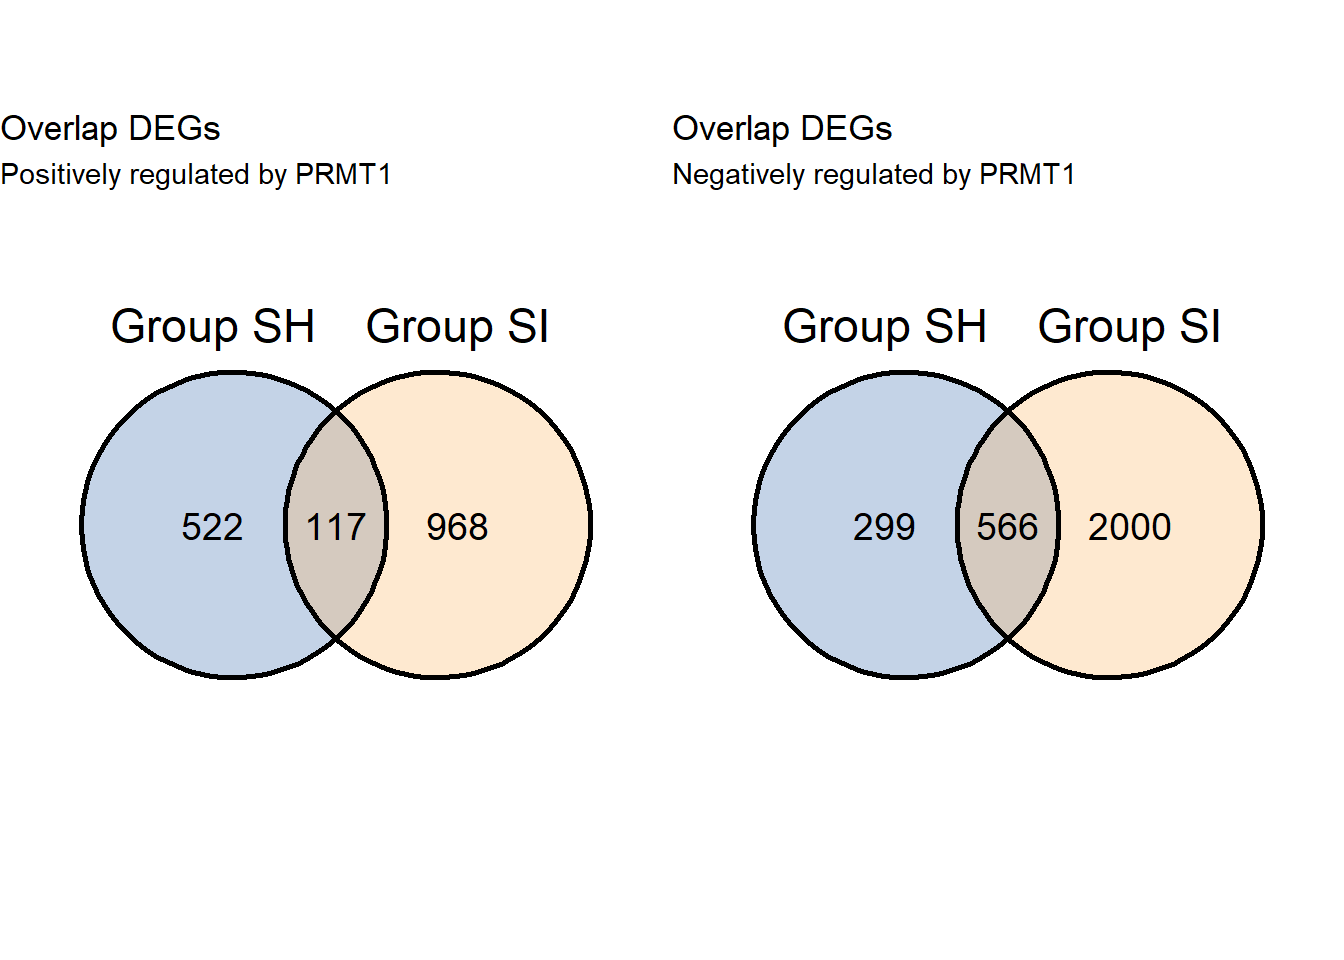
7.1.2 Datatable overlap
overlap<-as.data.frame(intersect(x=as.character(SH.regulated$Gene),y=as.character(SI.regulated$Gene)))
colnames(overlap)[1]<-"Gene"

overlap<-overlap %>%
  left_join(fc) %>%
  select(Gene,grupSH,grupSI)

S2.Positive.cor<-(overlap %>% filter(grupSH == 'Downregulated' & grupSI == 'Downregulated'))
create_dt(S2.Positive.cor)S2.Negative.cor<-(overlap %>% filter(grupSH == 'Upregulated' & grupSI == 'Upregulated'))
create_dt(S2.Negative.cor)7.1.3 Enrichment analysis (Positive)
library(enrichR)
setEnrichrSite("Enrichr") # Human genes
websiteLive <- TRUE


dbs <- c("KEGG_2021_Human","MSigDB_Hallmark_2020")
if (is.null(dbs)) websiteLive <- FALSE
if (websiteLive) {
    enriched <- enrichr(c(S2.Positive.cor$Gene), dbs)
}
## Uploading data to Enrichr... Done.
## Querying KEGG_2021_Human... Done.
## Querying MSigDB_Hallmark_2020... Done.
## Parsing results... Done.kegg.pos<-as.data.frame(if (websiteLive) enriched[["KEGG_2021_Human"]])
create_dt(kegg.pos)en.kegg.pos<-kegg.pos %>%
filter(P.value < 0.05) %>%
mutate(minlog=-(log10(P.value))) %>%
arrange(desc(minlog)) %>%
slice(1:20) %>%
mutate(name=fct_reorder(Term,minlog)) %>%
ggplot(aes(x=minlog,y=name,fill=minlog))+
geom_bar(stat="identity")+
theme_Publication()+
scale_x_continuous(expand=expand_scale(mult = c(0,0.2)))+
theme(axis.title.y = element_blank(),
legend.position = 'right',
legend.direction = 'vertical',
panel.grid.major.x = element_blank(),
aspect.ratio = 1.65,
legend.key.size= unit(.5, "cm"),
axis.text.y = element_text(size=10))+
scale_fill_viridis_c()+
xlab(expression(- log[10]*"(P-value)"))+
labs(fill=expression(- log[10]*"(P-value)"))+
ggtitle("KEGG_2021_Human",subtitle = 'Positively regulated by PRMT1')
en.kegg.pos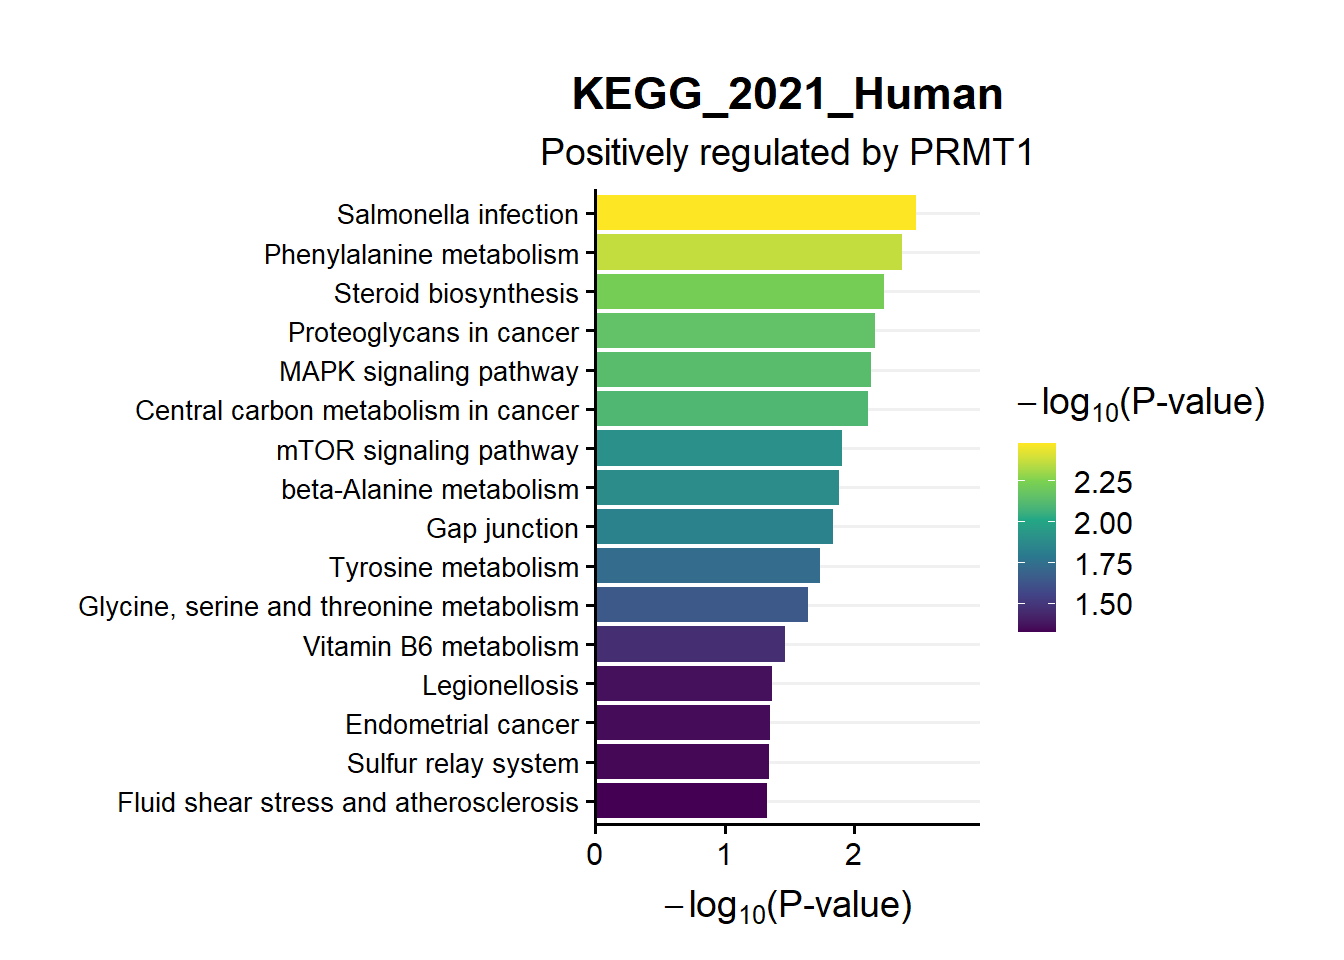
Msig.pos<-as.data.frame(if (websiteLive) enriched[["MSigDB_Hallmark_2020"]])
create_dt(Msig.pos)en.Msig.pos<-Msig.pos %>%
filter(P.value < 0.05) %>%
mutate(minlog=-(log10(P.value))) %>%
arrange(desc(minlog)) %>%
slice(1:20) %>%
mutate(name=fct_reorder(Term,minlog)) %>%
ggplot(aes(x=minlog,y=name,fill=minlog))+
geom_bar(stat="identity")+
theme_Publication()+
scale_x_continuous(expand=expand_scale(mult = c(0,0.2)))+
theme(axis.title.y = element_blank(),
legend.position = 'right',
legend.direction = 'vertical',
panel.grid.major.x = element_blank(),
aspect.ratio = 1.7,
legend.key.size= unit(.5, "cm"))+
scale_fill_viridis_c()+
xlab(expression(- log[10]*"(P-value)"))+
labs(fill=expression(- log[10]*"(P-value)"))+
ggtitle("MSigDB_Hallmark_2020",subtitle = 'Positively regulated by PRMT1')
en.Msig.pos
7.1.4 Enrichment analysis (negative)
library(enrichR)
setEnrichrSite("Enrichr") # Human genes
websiteLive <- TRUE


dbs <- c("KEGG_2021_Human","MSigDB_Hallmark_2020")
if (is.null(dbs)) websiteLive <- FALSE
if (websiteLive) {
    enriched <- enrichr(c(S2.Negative.cor$Gene), dbs)
}
## Uploading data to Enrichr... Done.
## Querying KEGG_2021_Human... Done.
## Querying MSigDB_Hallmark_2020... Done.
## Parsing results... Done.kegg.neg<-as.data.frame(if (websiteLive) enriched[["KEGG_2021_Human"]])
create_dt(kegg.neg)en.kegg.neg<-kegg.neg %>%
filter(P.value < 0.05) %>%
mutate(minlog=-(log10(P.value))) %>%
arrange(desc(minlog)) %>%
slice(1:20) %>%
mutate(name=fct_reorder(Term,minlog)) %>%
ggplot(aes(x=minlog,y=name,fill=minlog))+
geom_bar(stat="identity")+
theme_Publication()+
scale_x_continuous(expand=expand_scale(mult = c(0,0.2)))+
theme(axis.title.y = element_blank(),
legend.position = 'right',
legend.direction = 'vertical',
panel.grid.major.x = element_blank(),
aspect.ratio = 1.65,
legend.key.size= unit(.5, "cm"))+
scale_fill_viridis_c()+
xlab(expression(- log[10]*"(P-value)"))+
labs(fill=expression(- log[10]*"(P-value)"))+
ggtitle("KEGG_2021_Human",subtitle = 'Negatively regulated by PRMT1')
en.kegg.neg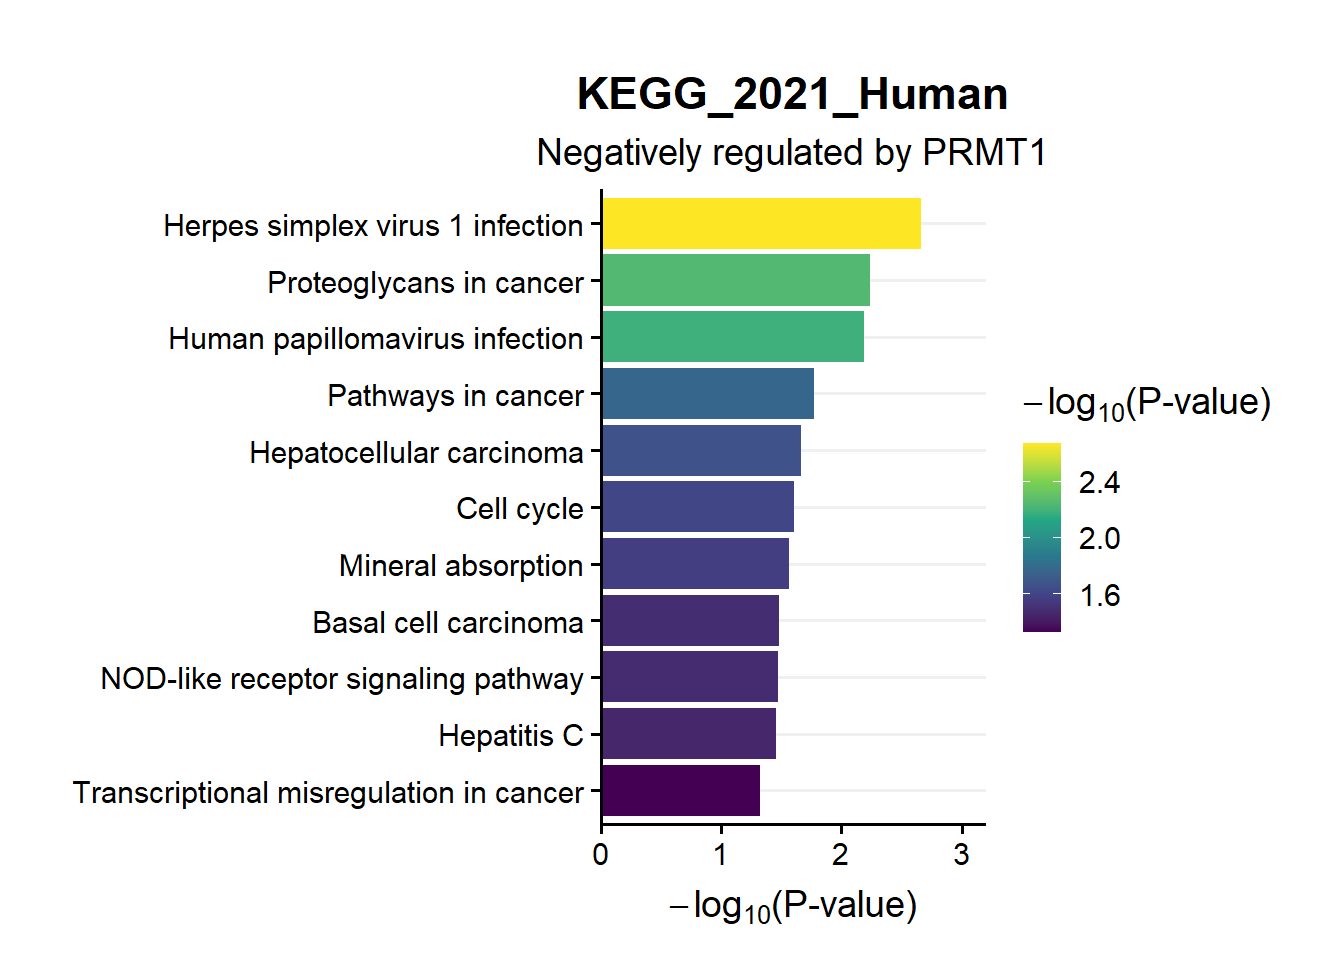
Msig.neg<-as.data.frame(if (websiteLive) enriched[["MSigDB_Hallmark_2020"]])
create_dt(Msig.neg)en.Msig.neg<-Msig.neg %>%
filter(P.value < 0.05) %>%
mutate(minlog=-(log10(P.value))) %>%
arrange(desc(minlog)) %>%
slice(1:20) %>%
mutate(name=fct_reorder(Term,minlog)) %>%
ggplot(aes(x=minlog,y=name,fill=minlog))+
geom_bar(stat="identity")+
theme_Publication()+
scale_x_continuous(expand=expand_scale(mult = c(0,0.2)))+
theme(axis.title.y = element_blank(),
legend.position = 'right',
legend.direction = 'vertical',
panel.grid.major.x = element_blank(),
aspect.ratio = .5,
legend.key.size= unit(.5, "cm"))+
scale_fill_viridis_c()+
xlab(expression(- log[10]*"(P-value)"))+
labs(fill=expression(- log[10]*"(P-value)"))+
ggtitle("MSigDB_Hallmark_2020",subtitle = 'Negatively regulated by PRMT1')
en.Msig.neg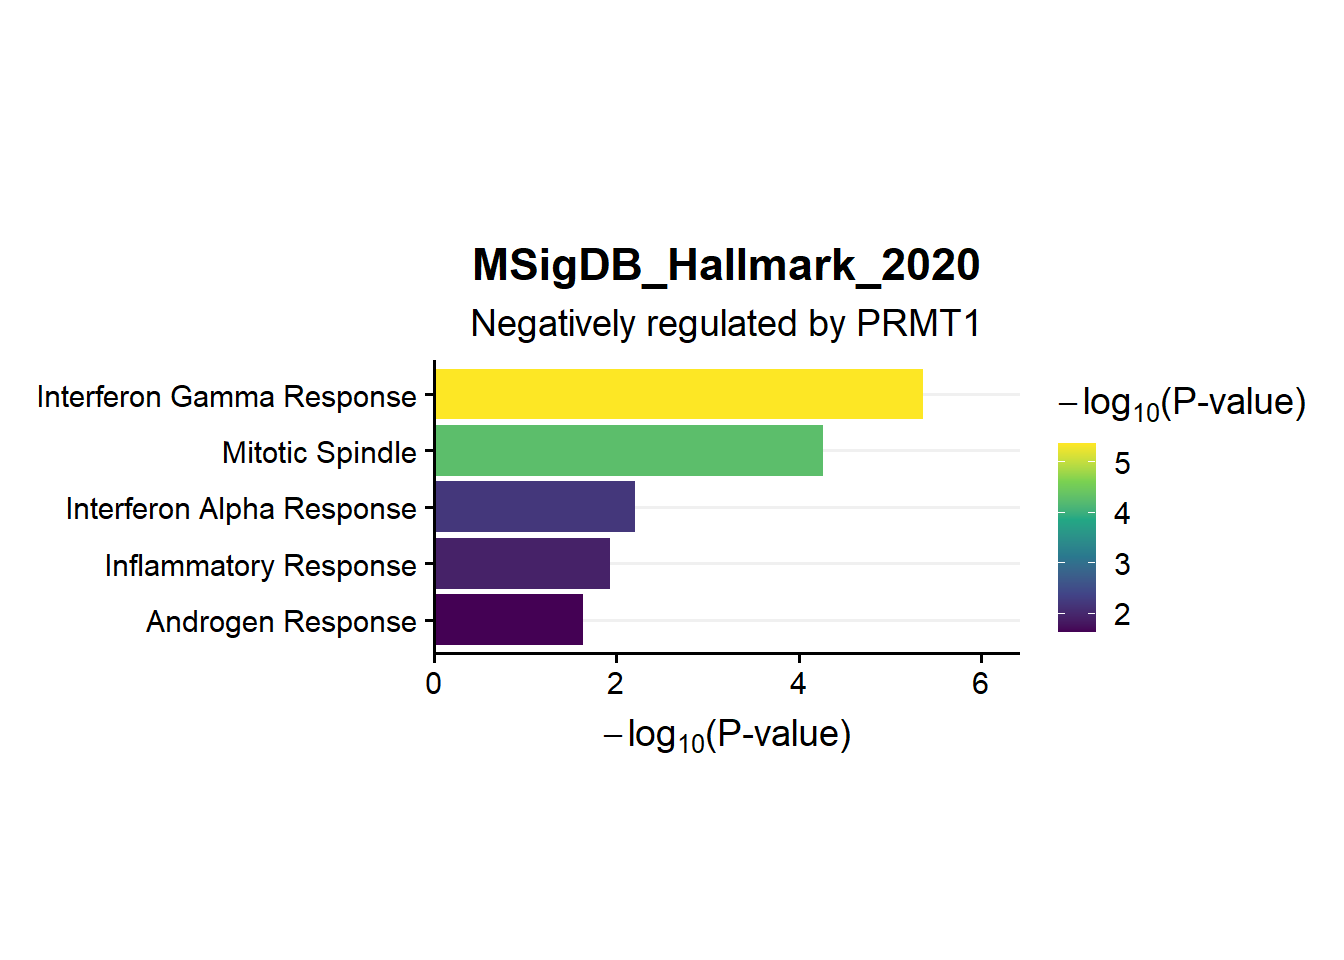
7.2 Recovery
- Since there is no replicate in recovery, instead of making venn diagram, we can directly assign positive and negative DEGs
7.2.1 Datatable
s2.REC.pos<-REC.regulated %>%
  filter(grupREC=='Upregulated') %>%
  select(Gene,grupREC)
create_dt(s2.REC.pos)s2.REC.neg<-REC.regulated %>%
filter(grupREC=='Downregulated') %>%
select(Gene,grupREC)
create_dt(s2.REC.neg)7.2.2 Enrichment (Positive)
setEnrichrSite("Enrichr") # Human genes
websiteLive <- TRUE
dbs <- c("KEGG_2021_Human","MSigDB_Hallmark_2020")
if (is.null(dbs)) websiteLive <- FALSE
if (websiteLive) {
    enriched <- enrichr(c(s2.REC.pos$Gene), dbs)
}
## Uploading data to Enrichr... Done.
## Querying KEGG_2021_Human... Done.
## Querying MSigDB_Hallmark_2020... Done.
## Parsing results... Done.kegg.pos<-as.data.frame(if (websiteLive) enriched[["KEGG_2021_Human"]])
create_dt(kegg.pos)en.kegg.pos<-kegg.pos %>%
filter(P.value < 0.05) %>%
mutate(minlog=-(log10(P.value))) %>%
arrange(desc(minlog)) %>%
slice(1:20) %>%
mutate(name=fct_reorder(Term,minlog)) %>%
ggplot(aes(x=minlog,y=name,fill=minlog))+
geom_bar(stat="identity")+
theme_Publication()+
scale_x_continuous(expand=expand_scale(mult = c(0,0.2)))+
theme(axis.title.y = element_blank(),
legend.position = 'right',
legend.direction = 'vertical',
panel.grid.major.x = element_blank(),
aspect.ratio = 1.9,
legend.key.size= unit(.5, "cm"),
axis.text.y=element_text(size = 10))+
scale_fill_viridis_c()+
xlab(expression(- log[10]*"(P-value)"))+
labs(fill=expression(- log[10]*"(P-value)"))+
ggtitle("KEGG_2021_Human",subtitle = 'Positively regulated by PRMT1')
en.kegg.pos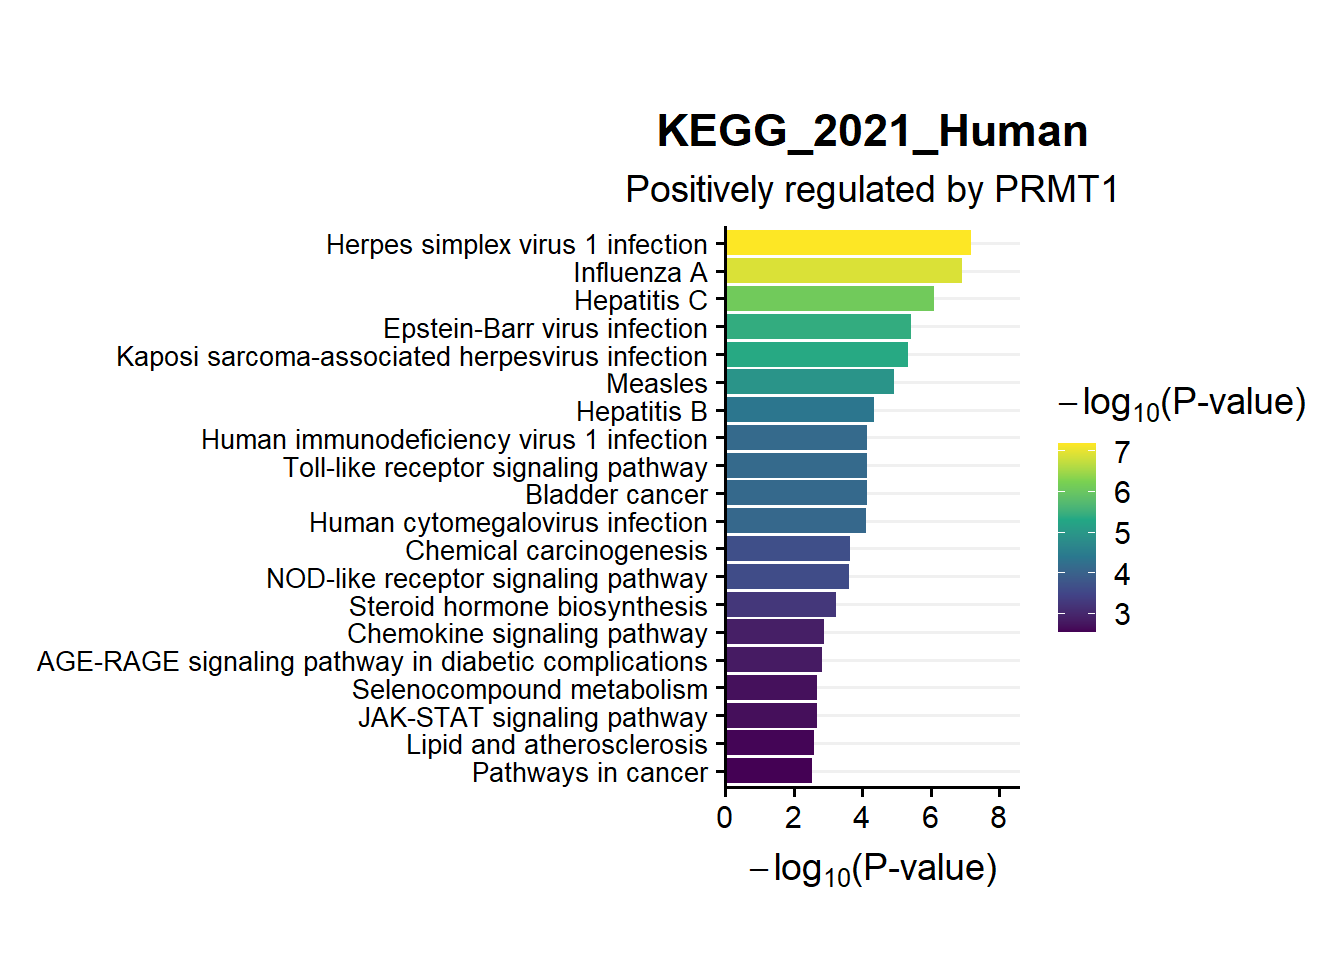
Msig.pos<-as.data.frame(if (websiteLive) enriched[["MSigDB_Hallmark_2020"]])
create_dt(Msig.pos)en.Msig.pos<-Msig.pos %>%
filter(P.value < 0.05) %>%
mutate(minlog=-(log10(P.value))) %>%
arrange(desc(minlog)) %>%
slice(1:20) %>%
mutate(name=fct_reorder(Term,minlog)) %>%
ggplot(aes(x=minlog,y=name,fill=minlog))+
geom_bar(stat="identity")+
theme_Publication()+
scale_x_continuous(expand=expand_scale(mult = c(0,0.2)))+
theme(axis.title.y = element_blank(),
legend.position = 'right',
legend.direction = 'vertical',
panel.grid.major.x = element_blank(),
aspect.ratio = 1.65,
legend.key.size= unit(.5, "cm"))+
scale_fill_viridis_c()+
xlab(expression(- log[10]*"(P-value)"))+
labs(fill=expression(- log[10]*"(P-value)"))+
ggtitle("MSigDB_Hallmark_2020",subtitle = 'Positively regulated by PRMT1')
en.Msig.pos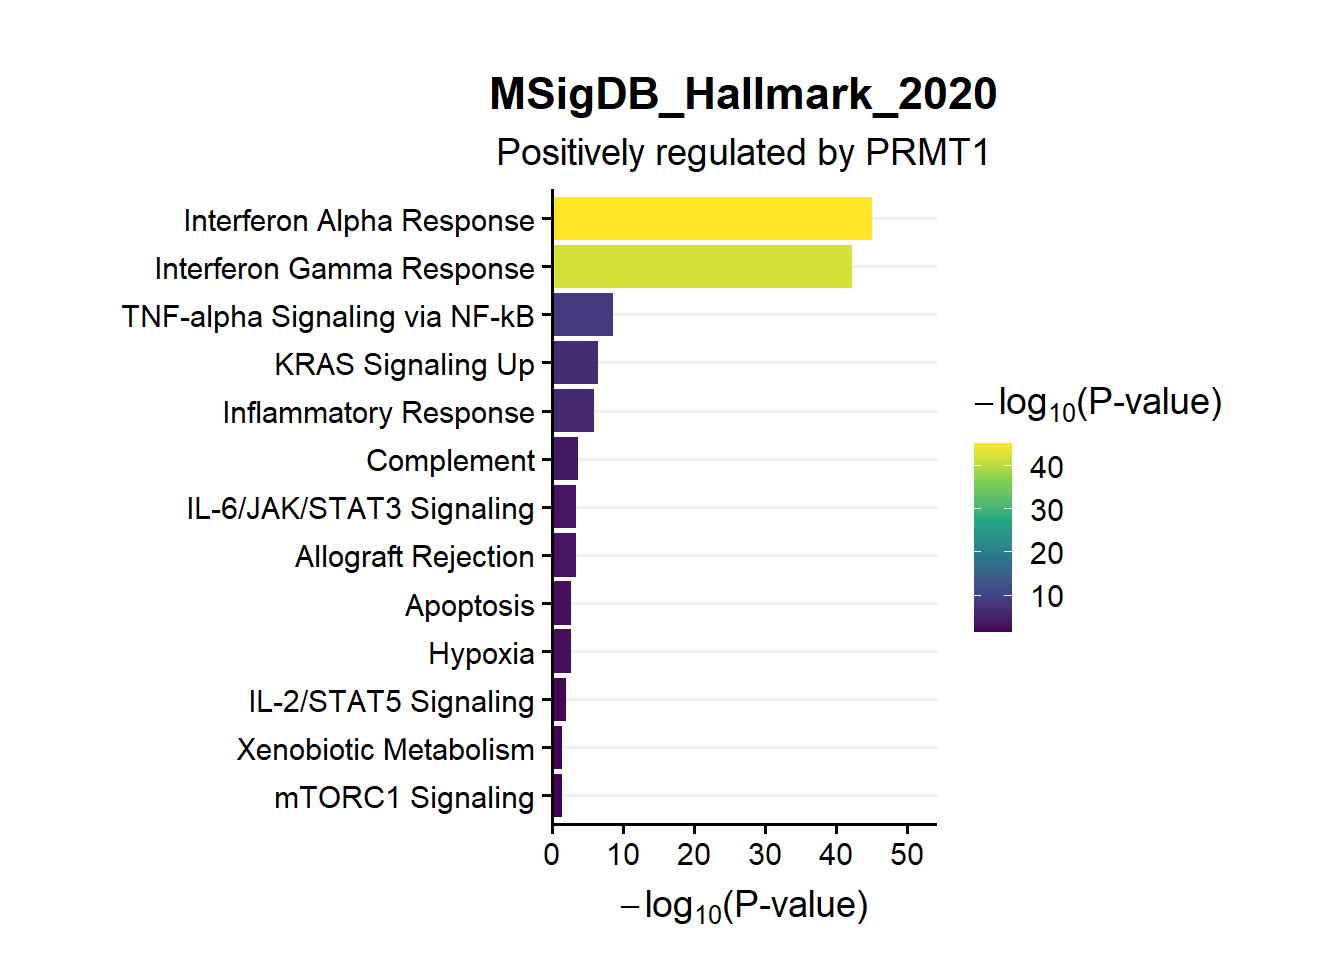
7.2.3 Enrichment (Negative)
setEnrichrSite("Enrichr") # Human genes
websiteLive <- TRUE
dbs <- c("KEGG_2021_Human","MSigDB_Hallmark_2020")
if (is.null(dbs)) websiteLive <- FALSE
if (websiteLive) {
    enriched <- enrichr(c(s2.REC.neg$Gene), dbs)
}
## Uploading data to Enrichr... Done.
## Querying KEGG_2021_Human... Done.
## Querying MSigDB_Hallmark_2020... Done.
## Parsing results... Done.kegg.neg<-as.data.frame(if (websiteLive) enriched[["KEGG_2021_Human"]])
create_dt(kegg.neg)en.kegg.neg<-kegg.neg %>%
filter(P.value < 0.05) %>%
mutate(minlog=-(log10(P.value))) %>%
arrange(desc(minlog)) %>%
slice(1:20) %>%
mutate(name=fct_reorder(Term,minlog)) %>%
ggplot(aes(x=minlog,y=name,fill=minlog))+
geom_bar(stat="identity")+
theme_Publication()+
scale_x_continuous(expand=expand_scale(mult = c(0,0.2)))+
theme(axis.title.y = element_blank(),
legend.position = 'right',
legend.direction = 'vertical',
panel.grid.major.x = element_blank(),
aspect.ratio = 1.65,
legend.key.size= unit(.5, "cm"))+
scale_fill_viridis_c()+
xlab(expression(- log[10]*"(P-value)"))+
labs(fill=expression(- log[10]*"(P-value)"))+
ggtitle("KEGG_2021_Human",subtitle = 'Negatively regulated by PRMT1')
en.kegg.neg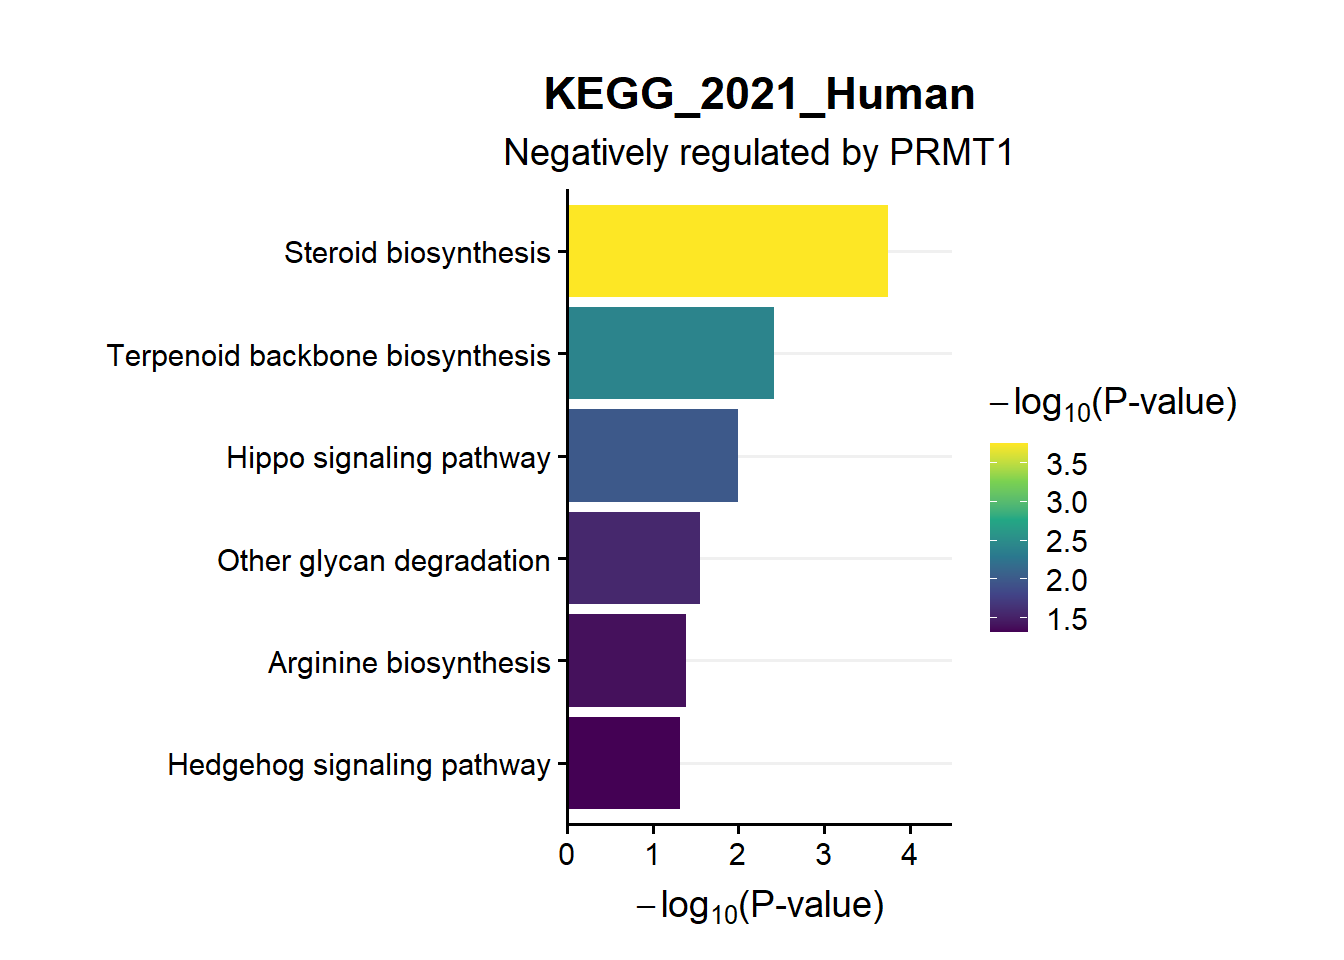
Msig.neg<-as.data.frame(if (websiteLive) enriched[["MSigDB_Hallmark_2020"]])
create_dt(Msig.neg)en.Msig.neg<-Msig.neg %>%
filter(P.value < 0.05) %>%
mutate(minlog=-(log10(P.value))) %>%
arrange(desc(minlog)) %>%
slice(1:20) %>%
mutate(name=fct_reorder(Term,minlog)) %>%
ggplot(aes(x=minlog,y=name,fill=minlog))+
geom_bar(stat="identity")+
theme_Publication()+
scale_x_continuous(expand=expand_scale(mult = c(0,0.2)))+
theme(axis.title.y = element_blank(),
legend.position = 'right',
legend.direction = 'vertical',
panel.grid.major.x = element_blank(),
aspect.ratio = 0.7,
legend.key.size= unit(.5, "cm"))+
scale_fill_viridis_c()+
xlab(expression(- log[10]*"(P-value)"))+
labs(fill=expression(- log[10]*"(P-value)"))+
ggtitle("MSigDB_Hallmark_2020",subtitle = 'Negatively regulated by PRMT1')
en.Msig.neg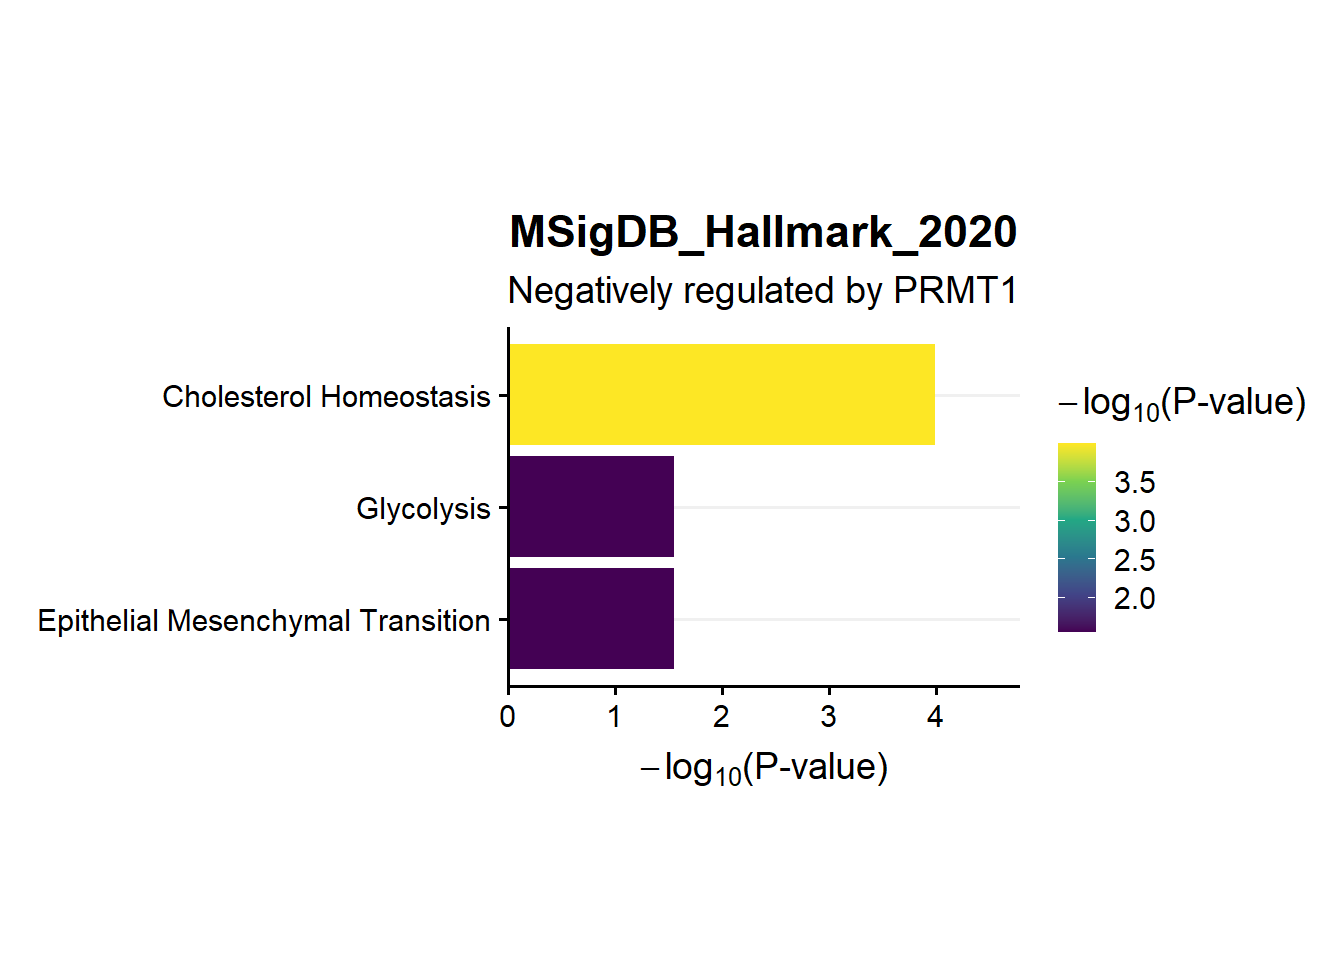
8 Scenario 3
In this scenario, we simply excluded si PRMT group.
8.1 Make venn
pos.SH<-SH.regulated %>%
  filter(grupSH=='Downregulated')
pos.REC<-REC.regulated %>%
  filter(grupREC=='Upregulated')
neg.SH<-SH.regulated %>%
  filter(grupSH=='Upregulated')
neg.REC<-REC.regulated %>%
  filter(grupREC=='Downregulated')

s3.list.pos<-list('Group SH'=as.character(pos.SH$Gene),
                   'Group Recovery'=as.character(pos.REC$Gene))
s3.list.neg<-list('Group SH'=as.character(neg.SH$Gene),
                   'Group Recovery'=as.character(neg.REC$Gene))


v3pos<-ggvenn(s3.list.pos,fill_color = c("#386cb0","#fdb462"),fill_alpha = .3,text_size = 5,show_percentage = F,set_name_size = 5)+
  ggtitle("Overlap DEGs",subtitle = "Positively regulated by PRMT1")
v3neg<-ggvenn(s3.list.neg,fill_color = c("#386cb0","#fdb462"),fill_alpha = .3,text_size = 5,show_percentage = F,set_name_size = 5)+
  ggtitle("Overlap DEGs",subtitle = "Negatively regulated by PRMT1")


grid.arrange(v3pos,v3neg,ncol=2)
8.1.1 Datatable
overlap<-as.data.frame(intersect(x=as.character(SH.regulated$Gene),y=as.character(REC.regulated$Gene)))
colnames(overlap)[1]<-"Gene"

overlap<-overlap %>%
  left_join(fc) %>%
  select(Gene,grupSH,grupREC)

# Positive
S3.Positive.cor<-(overlap %>% filter(grupSH == 'Downregulated' & grupREC == 'Upregulated'))
create_dt(S3.Positive.cor)#negative
S3.Negative.cor<-(overlap %>% filter(grupSH == 'Upregulated' & grupREC == 'Downregulated'))
create_dt(S3.Negative.cor)8.1.2 Enrichment (Positive)
library(enrichR)
setEnrichrSite("Enrichr") # Human genes
websiteLive <- TRUE


dbs <- c("KEGG_2021_Human","MSigDB_Hallmark_2020")
if (is.null(dbs)) websiteLive <- FALSE
if (websiteLive) {
    enriched <- enrichr(c(S3.Positive.cor$Gene), dbs)
}
## Uploading data to Enrichr... Done.
## Querying KEGG_2021_Human... Done.
## Querying MSigDB_Hallmark_2020... Done.
## Parsing results... Done.s3.kegg.pos<-as.data.frame(if (websiteLive) enriched[["KEGG_2021_Human"]])
create_dt(s1.kegg.pos)colnames(s3.kegg.pos)## [1] "Term" "Overlap" "P.value"
## [4] "Adjusted.P.value" "Old.P.value" "Old.Adjusted.P.value"
## [7] "Odds.Ratio" "Combined.Score" "Genes"en.kegg.pos<-s3.kegg.pos %>%
filter(P.value < 0.05) %>%
mutate(minlog=-(log10(P.value))) %>%
arrange(desc(minlog)) %>%
slice(1:20) %>%
mutate(name=fct_reorder(Term,minlog)) %>%
ggplot(aes(x=minlog,y=name,fill=minlog))+
geom_bar(stat="identity")+
theme_Publication()+
scale_x_continuous(expand=expand_scale(mult = c(0,0.2)))+
theme(axis.title.y = element_blank(),
legend.position = 'right',
legend.direction = 'vertical',
panel.grid.major.x = element_blank(),
aspect.ratio = 1.8,
legend.key.size= unit(.5, "cm"),
axis.text.y = element_text(size=9))+
scale_fill_viridis_c()+
xlab(expression(- log[10]*"(P-value)"))+
labs(fill=expression(- log[10]*"(P-value)"))+
ggtitle("Top 20 KEGG_2021_Human",subtitle = 'Positively regulated by PRMT1')
en.kegg.pos
Msig.pos<-as.data.frame(if (websiteLive) enriched[["MSigDB_Hallmark_2020"]])
create_dt(Msig.pos)s3.en.Msig.pos<-Msig.pos %>%
filter(P.value < 0.05) %>%
mutate(minlog=-(log10(P.value))) %>%
arrange(desc(minlog)) %>%
slice(1:20) %>%
mutate(name=fct_reorder(Term,minlog)) %>%
ggplot(aes(x=minlog,y=name,fill=minlog))+
geom_bar(stat="identity")+
theme_Publication()+
scale_x_continuous(expand=expand_scale(mult = c(0,0.2)))+
theme(axis.title.y = element_blank(),
legend.position = 'right',
legend.direction = 'vertical',
panel.grid.major.x = element_blank(),
aspect.ratio = 1,
legend.key.size= unit(.5, "cm"))+
scale_fill_viridis_c()+
xlab(expression(- log[10]*"(P-value)"))+
labs(fill=expression(- log[10]*"(P-value)"))+
ggtitle("MSigDB_Hallmark_2020",subtitle = 'Positively regulated by PRMT1')
s3.en.Msig.pos
8.1.3 Enrichment (Negative)
library(enrichR)
setEnrichrSite("Enrichr") # Human genes
websiteLive <- TRUE


dbs <- c("KEGG_2021_Human","MSigDB_Hallmark_2020")
if (is.null(dbs)) websiteLive <- FALSE
if (websiteLive) {
    enriched <- enrichr(c(S3.Negative.cor$Gene), dbs)
}
## Uploading data to Enrichr... Done.
## Querying KEGG_2021_Human... Done.
## Querying MSigDB_Hallmark_2020... Done.
## Parsing results... Done.kegg.neg<-as.data.frame(if (websiteLive) enriched[["KEGG_2021_Human"]])
create_dt(kegg.neg)en.kegg.neg<-kegg.neg %>%
filter(P.value < 0.05) %>%
mutate(minlog=-(log10(P.value))) %>%
arrange(desc(minlog)) %>%
slice(1:20) %>%
mutate(name=fct_reorder(Term,minlog)) %>%
ggplot(aes(x=minlog,y=name,fill=minlog))+
geom_bar(stat="identity")+
theme_Publication()+
scale_x_continuous(expand=expand_scale(mult = c(0,0.2)))+
theme(axis.title.y = element_blank(),
legend.position = 'right',
legend.direction = 'vertical',
panel.grid.major.x = element_blank(),
aspect.ratio = 1.5,
legend.key.size= unit(.5, "cm"))+
scale_fill_viridis_c()+
xlab(expression(- log[10]*"(P-value)"))+
labs(fill=expression(- log[10]*"(P-value)"))+
ggtitle("KEGG_2021_Human",subtitle = 'Negatively regulated by PRMT1')
en.kegg.neg
Msig.neg<-as.data.frame(if (websiteLive) enriched[["MSigDB_Hallmark_2020"]])
create_dt(Msig.neg)en.Msig.neg<-Msig.neg %>%
filter(P.value < 0.05) %>%
mutate(minlog=-(log10(P.value))) %>%
arrange(desc(minlog)) %>%
slice(1:20) %>%
mutate(name=fct_reorder(Term,minlog)) %>%
ggplot(aes(x=minlog,y=name,fill=minlog))+
geom_bar(stat="identity")+
theme_Publication()+
scale_x_continuous(expand=expand_scale(mult = c(0,0.2)))+
theme(axis.title.y = element_blank(),
legend.position = 'right',
legend.direction = 'vertical',
panel.grid.major.x = element_blank(),
aspect.ratio = .25,
legend.key.size= unit(.5, "cm"))+
scale_fill_viridis_c()+
xlab(expression(- log[10]*"(P-value)"))+
labs(fill=expression(- log[10]*"(P-value)"))+
ggtitle("MSigDB_Hallmark_2020",subtitle = 'Negatively regulated by PRMT1')
en.Msig.neg
9 Conclusion
- From the results above, it seems that although overlapping genes in 3 conditions (Scenario 1) identified less in venn diagram compared to Scenario 2, the enrichment analysis showed better results (reference to other enrichment analysis from other PRMT1 RNAseq published paper)
- We can now collect and tweak the figuring for publication
- For example for enrichment, we chose only KEGG and selected certain terms
9.1 KEGG term selected
create_dt(s1.kegg.pos)en.kegg.pos<-s1.kegg.pos %>%
filter(P.value < 0.05) %>%
mutate(minlog=-(log10(P.value))) %>%
arrange(desc(minlog)) %>%
slice(1:20) %>%
filter(Term == "Proteoglycans in cancer" |
Term == "Salmonella infection"|
Term == "MAPK signaling pathway"|
Term == "Signaling pathways regulating pluripotency of stem cells"|
Term == "Breast cancer"|
Term == "Gastric cancer") %>%
mutate(name=fct_reorder(Term,minlog)) %>%
ggplot(aes(x=minlog,y=name,fill=minlog))+
geom_bar(stat="identity")+
theme_Publication()+
scale_x_continuous(expand=expand_scale(mult = c(0,0.2)))+
theme(axis.title.y = element_blank(),
legend.position = 'right',
legend.direction = 'vertical',
panel.grid.major.x = element_blank(),
aspect.ratio = 1.5,
legend.key.size= unit(.5, "cm"))+
scale_fill_viridis_c()+
xlab(expression(- log[10]*"(P-value)"))+
labs(fill=expression(- log[10]*"(P-value)"))+
ggtitle("KEGG_2021_Human",subtitle = 'Positively regulated by PRMT1')
en.kegg.pos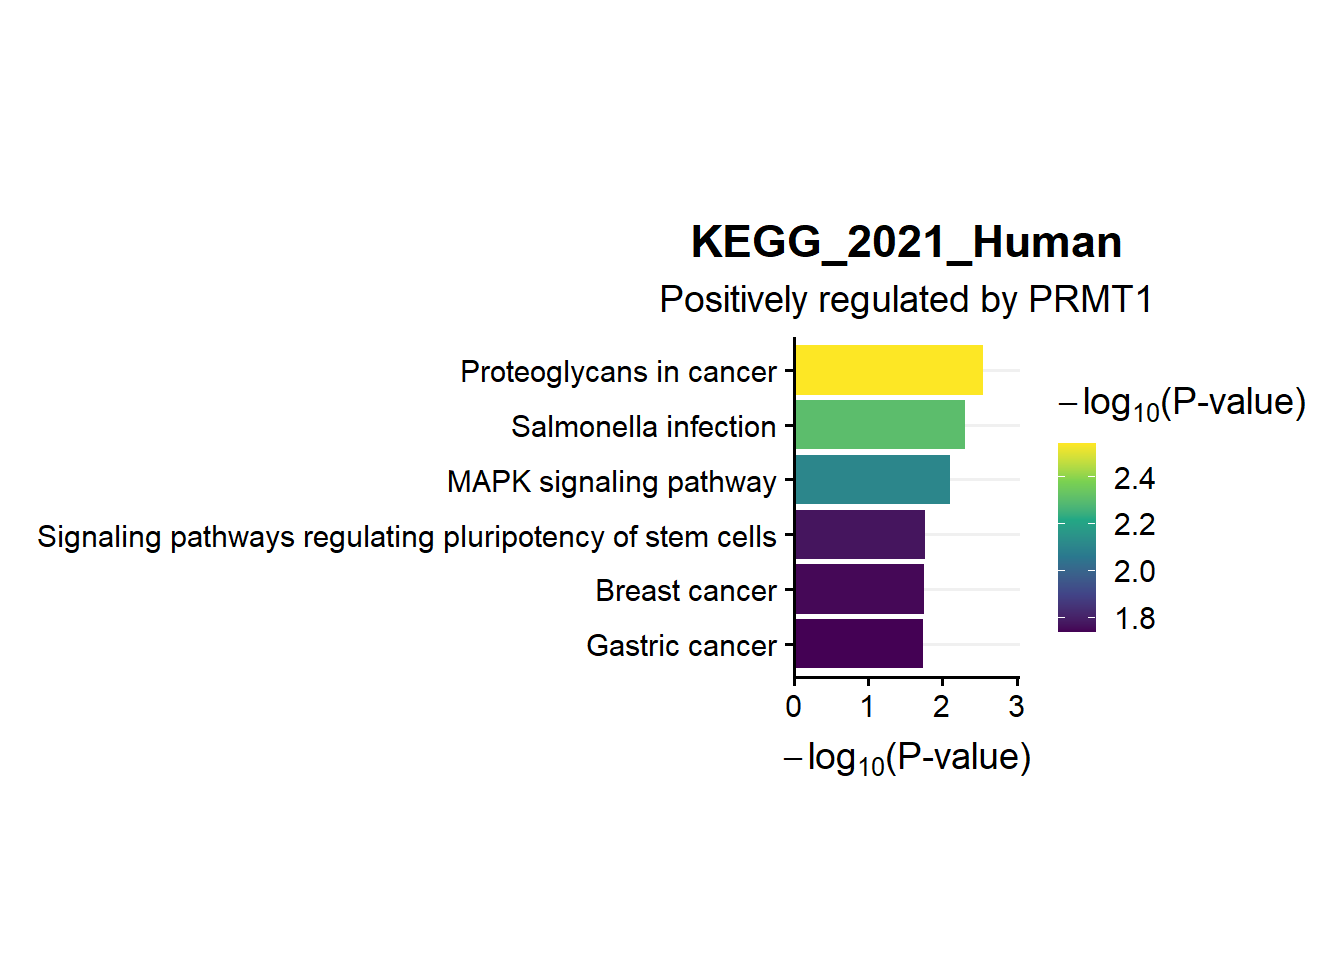
9.2 Connecting with clinical specimen
- Remember, KEGG above is only enrichment from 28 genes as show in venn and datatable below. In total 28+14= 42 genes are regulated by PRMT1, now how about the expression of these genes in gastric cancer tissues?
grid.arrange(v1pos,v1neg,ncol=2)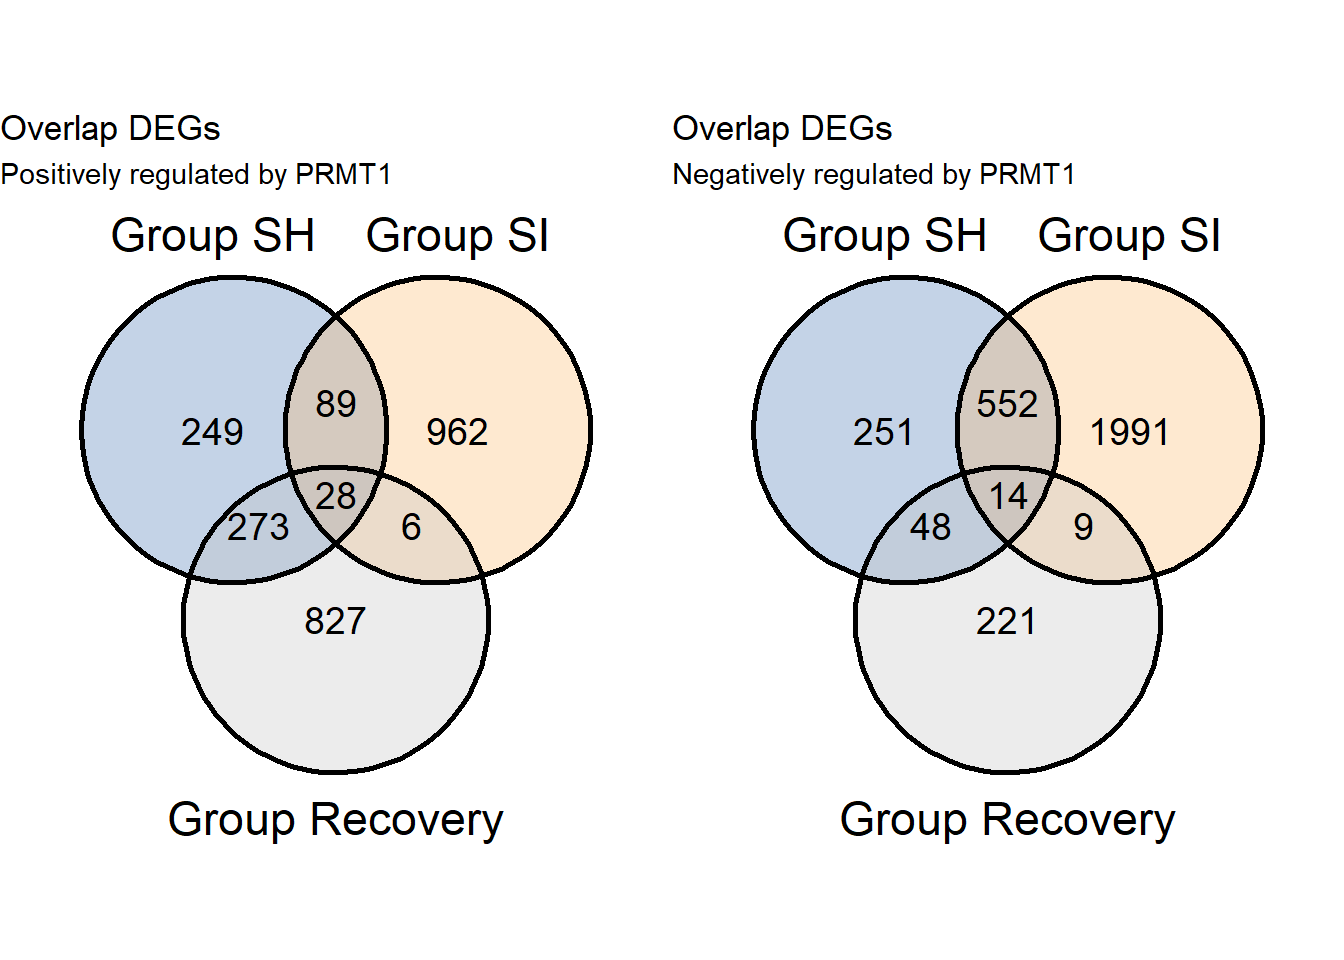
# Positive
create_dt(S1.Positive.cor)# Negative
create_dt(S1.Negative.cor)# In Gene Expression Note 2 we have downloaded rse of STAD TCGA using TCGAbiolinks
## Just need data preparation, normalization, filtering, and retrieve 42 genes from this dataset
library(TCGAbiolinks)
rse <- get(load("STADIllumina_HiSeq.rda"))
dataPrep_STAD<-TCGAanalyze_Preprocessing(rse,
cor.cut = .5,
datatype = "raw_count",
filename = "STAD_IlluminaHiSeq_RNASeqV2.png")
# Normalization and filtering
dataNorm<-TCGAanalyze_Normalization(tabDF = dataPrep_STAD,geneInfo = geneInfo,method = "gcContent")
dim(dataNorm)## [1] 19866 415# quantile filter of genes
dataFilt <- TCGAanalyze_Filtering(tabDF = dataNorm,
method = "quantile",
qnt.cut = 0.25)
dim(dataFilt)## [1] 14899 4159.2.1 Gene filtering
f.dataFilt<-dataFilt
dim(f.dataFilt)
## [1] 14899 415f.dataFilt<-as.data.frame(f.dataFilt) %>%
mutate(Gene=row.names(f.dataFilt)) %>%
select(416,1:415)
rownames(f.dataFilt)<-NULL
# get both pos and neg genes
genelist<-rbind(S1.Positive.cor,S1.Negative.cor) %>%
select(Gene)
# vlookup leftjoin to other parameter
genelist<-genelist %>%
left_join(f.dataFilt)
# check how many genes does not have expression
# probably different gene names/id
# or excluded before because of filtering threshold
sum(is.na(genelist$`TCGA-3M-AB46-01A-11R-A414-31`)) #total 9 genes were not identified, let's ignore this for now## [1] 9# exclude those gene
genelist<-genelist %>%
drop_na()
create_dt(genelist)9.2.2 Heatmap
- Now, Let’s try make a heatmap of all patients and do both row and column clustering.
h.genelist<-genelist
h.genelist<-t(h.genelist)
colnames(h.genelist)<-h.genelist[1,]
h.genelist<-h.genelist[-1,]

# remove 0
h.genelist[h.genelist==0] <- NA
h.genelist<-h.genelist[complete.cases(h.genelist),]


m.genelist<-matrix(as.numeric(h.genelist),
                   ncol=ncol(h.genelist))
colnames(m.genelist)<-colnames(h.genelist)
rownames(m.genelist)<-rownames(m.genelist)

m.genelist[m.genelist==0] <- NA
m.genelist<-m.genelist[complete.cases(m.genelist),]

m.genelist<-log(m.genelist)

library(pheatmap)
library(viridis)

cal_z_score <- function(x){
  (x - mean(x)) / sd(x)
}

data_subset_norm <- apply(m.genelist, 2, cal_z_score)
data_subset_norm[data_subset_norm < -2] = -2
data_subset_norm[data_subset_norm > 2] = 2

pheatmap::pheatmap(t(data_subset_norm),
         border_color = 'white')
df.genelist<-as.data.frame(m.genelist)#save the heatmap
png('heatmap prmt shrec stad.png',
width=1800,height=600,res=150)
dev.off()## png
## 29.2.3 Correlation
- The heatmap does not look good. Probably there are some genes which are not correlated between the DEGs found in our RNAseq and patient tissues.
- Hence, let’s try to make correlation matrix first
9.2.3.1 Corelation matrix
library(ggstatsplot)
ggstatsplot::ggcorrmat(
  data = df.genelist,
  type = "parametric", # parametric for Pearson, nonparametric for Spearman's correlation
  colors = c("steelblue","white","darkred"), # change default colors
  title = "Correlation matrix of DEGs",
  subtitle = "Stomach Adenocarcinoma (STAD-TCGA)",
  matrix.type ='upper',
  ggcorrplot.args = list(outline.color = "white",
                         hc.order = TRUE, #clustering
                         pch.cex=3, # x size
                         lab_size=3.25) #label size

)+ggplot2::theme(aspect.ratio = 1,
                 axis.text = element_text(size=10, colour = 'black',family = 'Arial'),
                 axis.text.x= element_text(family = 'Arial',hjust =0,vjust = 1)
                 )+scale_x_discrete(position = 'top')
9.2.3.2 Correlation plot
- From the plot above, we can see that PRMT1 significantly (positively) correlate with TTC5,TFB2M, MYC, C16orf91,and PTS while (negatively) correlate with ZDHHC1, AKT3, EVI5L, TP53INP2, and PTPRB.
- Now we can make the correlation plot of individual patients and statistical analysis
# wide to long for positive
df.genelist %>%
  gather('Gene','Value',c(TTC5,TFB2M,MYC, C16orf91,PTS)) %>%
  select(Gene,Value,PRMT1) %>%
    ggplot(aes(x=Value,y=PRMT1))+
    geom_smooth(method=lm, fullrange=FALSE,se=TRUE)+
    geom_point()+
  facet_grid(~Gene,scales = "free_x")+
    theme_Publication()+
  theme(aspect.ratio = 1,
        axis.title.x = element_blank())
# wide to long for negative
df.genelist %>%
  gather('Gene','Value',c(ZDHHC1, AKT3, EVI5L, TP53INP2, PTPRB)) %>%
  select(Gene,Value,PRMT1) %>%
    ggplot(aes(x=Value,y=PRMT1))+
    geom_smooth(method=lm, fullrange=FALSE,se=TRUE)+
    geom_point()+
  facet_grid(~Gene,scales = "free_x")+
  theme_Publication()+
  theme(aspect.ratio = 1,
        axis.title.x = element_blank())
9.2.3.3 Datatable correlation
# You can check R and P value one by one like this
cor.test(df.genelist$PRMT1,df.genelist$MYC)
##
## Pearson's product-moment correlation
##
## data: df.genelist$PRMT1 and df.genelist$MYC
## t = 6.0691, df = 365, p-value = 3.224e-09
## alternative hypothesis: true correlation is not equal to 0
## 95 percent confidence interval:
## 0.2067989 0.3929508
## sample estimates:
## cor
## 0.3027596# or using this
library(correlation)
cor.df.genelist<-df.genelist %>%
select(PRMT1,TTC5,TFB2M,MYC, C16orf91,PTS,ZDHHC1, AKT3, EVI5L, TP53INP2, PTPRB)
correlation::correlation(cor.df.genelist,
include_factors = TRUE, method = "auto"
) %>%
filter(Parameter1 == 'PRMT1')## # Correlation Matrix (auto-method)
##
## Parameter1 | Parameter2 | r | 95% CI | t(365) | p
## ---------------------------------------------------------------------
## PRMT1 | TTC5 | 0.29 | [ 0.19, 0.38] | 5.74 | < .001***
## PRMT1 | TFB2M | 0.42 | [ 0.33, 0.50] | 8.74 | < .001***
## PRMT1 | MYC | 0.30 | [ 0.21, 0.39] | 6.07 | < .001***
## PRMT1 | C16orf91 | 0.35 | [ 0.26, 0.44] | 7.12 | < .001***
## PRMT1 | PTS | 0.34 | [ 0.24, 0.43] | 6.87 | < .001***
## PRMT1 | ZDHHC1 | -0.24 | [-0.33, -0.14] | -4.63 | < .001***
## PRMT1 | AKT3 | -0.23 | [-0.32, -0.13] | -4.45 | < .001***
## PRMT1 | EVI5L | -0.27 | [-0.36, -0.17] | -5.35 | < .001***
## PRMT1 | TP53INP2 | -0.36 | [-0.44, -0.26] | -7.26 | < .001***
## PRMT1 | PTPRB | -0.32 | [-0.41, -0.22] | -6.37 | < .001***
##
## p-value adjustment method: Holm (1979)
## Observations: 3679.2.3.4 Selected Heatmap and Cor. Matrix
sel.df.genelist<-df.genelist %>%
  select(PRMT1,TTC5,TFB2M,MYC,C16orf91,PTS,ZDHHC1,EVI5L,PTPRB)

ggstatsplot::ggcorrmat(
  data = sel.df.genelist,
  type = "parametric", # parametric for Pearson, nonparametric for Spearman's correlation
  colors = c("steelblue","white","darkred"), # change default colors
  title = "Correlation matrix of DEGs",
  subtitle = "Stomach Adenocarcinoma (STAD-TCGA)",
  matrix.type ='upper',
  ggcorrplot.args = list(outline.color = "white",
                         hc.order = TRUE, #clustering
                         pch.cex=4, # x size
                         lab_size=3.25) #label size

)+ggplot2::theme(aspect.ratio = 1,
                 axis.text = element_text(size=10, colour = 'black',family = 'Arial'),
                 axis.text.x= element_text(family = 'Arial',hjust =0,vjust = 1)
)+scale_x_discrete(position = 'top')
##########

h.genelist<-genelist
h.genelist<-h.genelist %>%
  filter(Gene == 'PRMT1' |
           Gene == 'TTC5'|
           Gene == 'TFB2M'|
           Gene == 'MYC'|
           Gene == 'C16orf91'|
           Gene == 'PTS'|
           Gene == 'ZDHHC1'|
           Gene == 'EVI5L' |
           Gene == 'PTPRB')

h.genelist<-t(h.genelist)
colnames(h.genelist)<-h.genelist[1,]
h.genelist<-h.genelist[-1,]

# remove 0
h.genelist[h.genelist==0] <- NA
h.genelist<-h.genelist[complete.cases(h.genelist),]


m.genelist<-matrix(as.numeric(h.genelist),
                   ncol=ncol(h.genelist))
colnames(m.genelist)<-colnames(h.genelist)
rownames(m.genelist)<-rownames(m.genelist)

m.genelist[m.genelist==0] <- NA
m.genelist<-m.genelist[complete.cases(m.genelist),]

m.genelist<-log(m.genelist)

library(pheatmap)
library(viridis)
library(ComplexHeatmap)

cal_z_score <- function(x){
  (x - mean(x)) / sd(x)
}

data_subset_norm <- apply(m.genelist, 2, cal_z_score)
data_subset_norm[data_subset_norm < -2] = -2
data_subset_norm[data_subset_norm > 2] = 2

colmy<-colorRampPalette(c("#4DBBD5B2","white","#E64B35B2"))(50)
colmy<-paste0(colmy,'7f')
ComplexHeatmap::pheatmap(t(data_subset_norm),
show_colnames = F,
color = colmy,
#row_title = "Genes", row_title_rot = 0,
column_title = "Patients",
heatmap_legend_param = list(title = gt_render("<span style='color:black'>*z-score*</span>")))